


Here’s the rundown for the last week:
- Purchase application data has stabilized — the bleeding stopped.
- Housing inventory increased by 1,339 homes nationwide. This is a small number but could be the start of an important trend.
- Mortgage rates fell along with bond yields, showing that mortgage rates peaked on Oct. 20.
The weekly data shows some good news for the housing market! The weekly inventory data, which had fallen faster than I had anticipated the last few weeks, has now seen a slight uptick. With mortgage rates also falling, I am hopeful that more people will list their homes and buy another, so we can get back to a more functional housing market.
One of my biggest concerns for housing started at the end of June 2022: once mortgage rates got above 6%, the new listing data began to decline faster and earlier than normal. This is a problem for the existing home sales market since a traditional seller is usually also a buyer, so the lack of listing growth was a big hit to demand.
We will get the next existing home sales report on Friday, and I expect to see demand keep falling. But after this week’s report, we should have a low-level base formed for housing to stabilize.
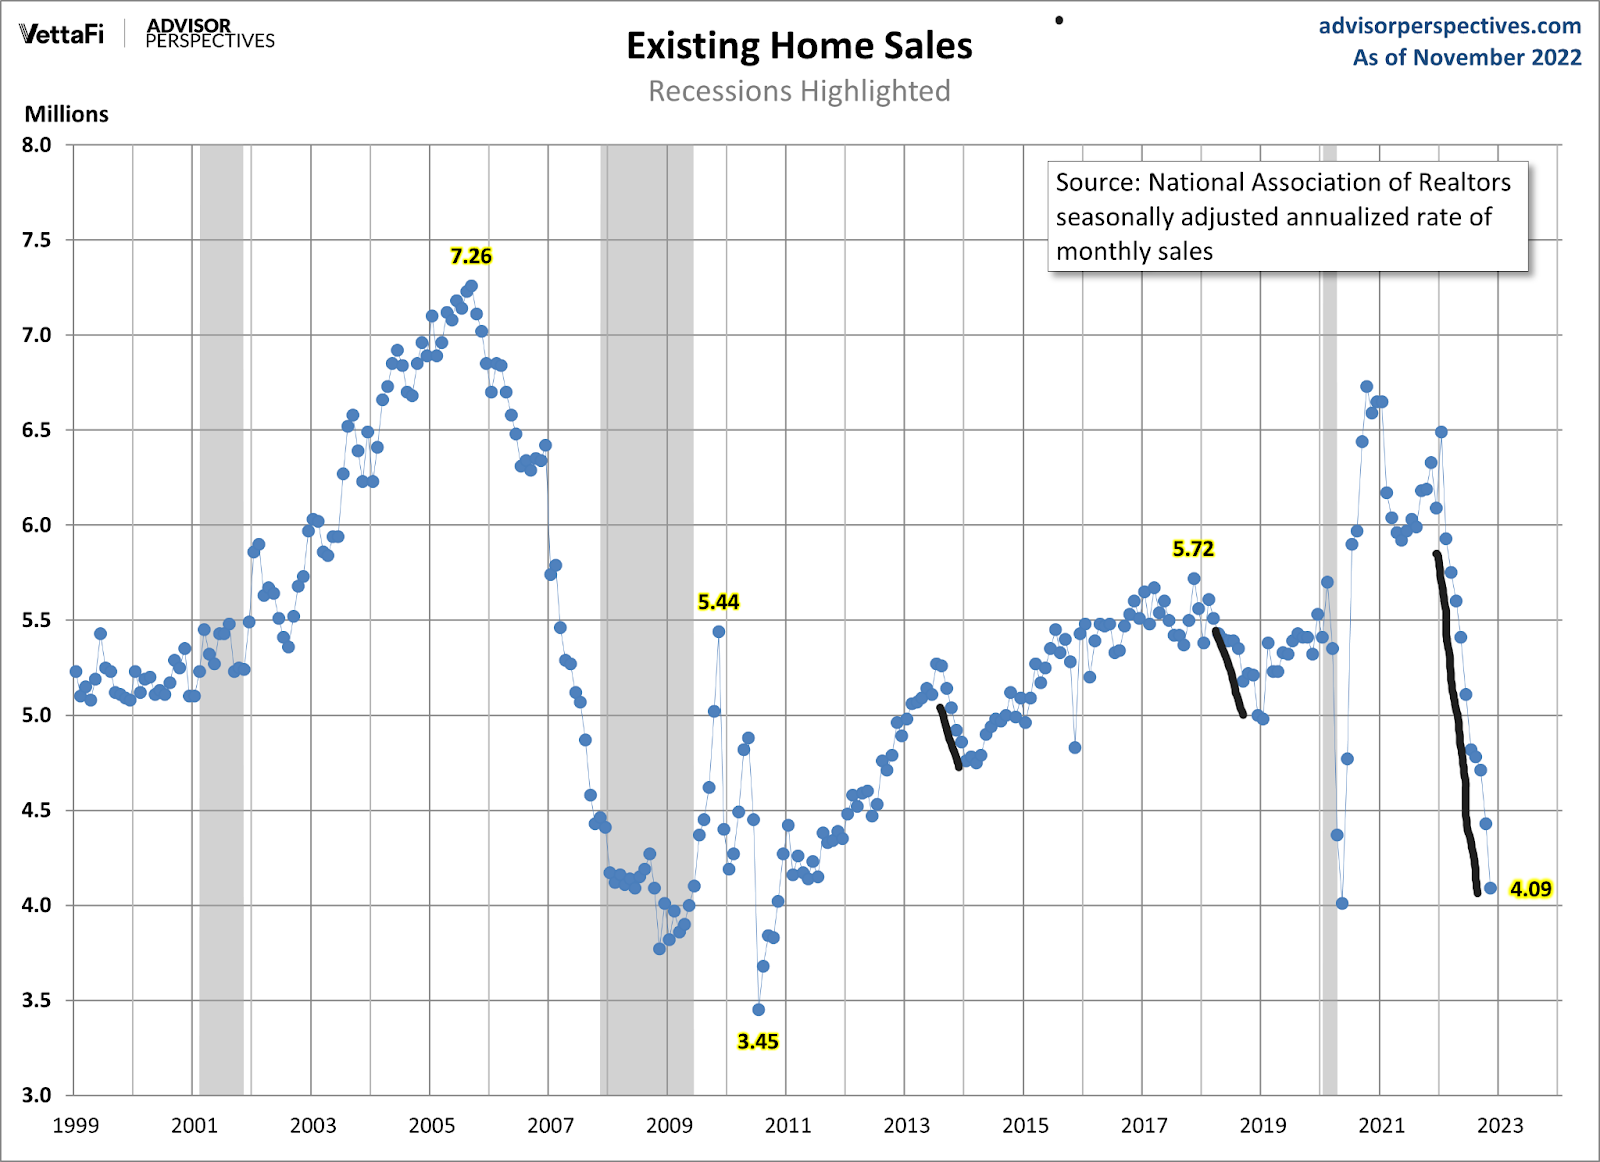
As you can see below, the waterfall dive in existing home sales has taken us toward the level of 2007-2008 monthly home sales. In general, it’s rare to have monthly sales below 4 million post 1996, but we have a shot of this happening on Friday.
However, the next existing home sales report will be for December, which is backward-looking, and now it’s time to look forward.
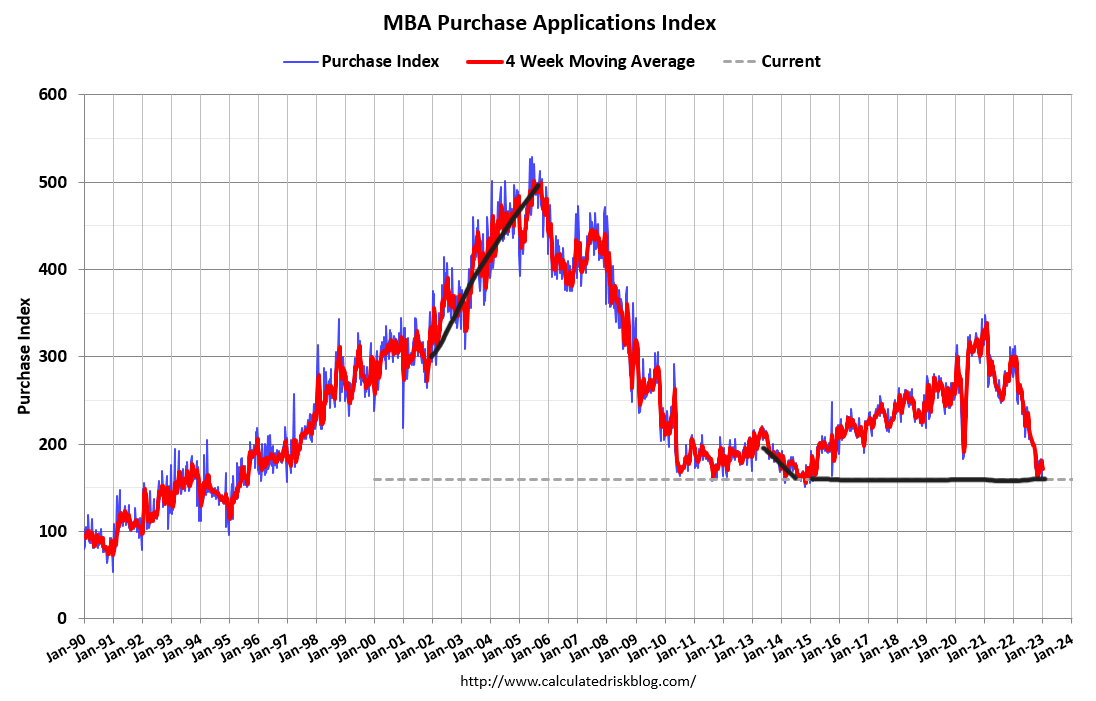
The best way to look forward is the purchase application data, which has formed a bottom for now since seven of the last 10 reports have been positive in a non-seasonal time of growth. Before that, the data was showing constant weakness, so the lower mortgage rate move since November has changed the dynamics with purchase application data.
Purchase application data
We are now fresh into the critical seasonal volume period for purchase application data, as I always weigh this index from the second week of January to the first week of May. One caution is that this data line took a waterfall dive, wiping out seven years of growth in 2022. The level is now so low that even a small improvement in demand could stabilize it.
In the last 10 weeks since mortgage rates have fallen, the index showed some weekly growth and the year-over-year decline stopped at negative 46%. However, volumes dry up yearly during the last and first weeks of the year, so reading the internals of the data is key even though volumes are historically low at this period.
This wasn’t the case last year, as it was an abnormal period for purchase application data which created very high year-over-year comps to deal with. This explains the major year-over-year declines we have seen since October. In fact, one of my big talking points for 2022 was that starting from October this index should be printing negative 35%-45% year-over-year declines until January.
Since October, the year-over-year declines have ranged between negative 36% to 46%. This looks normal to me considering how high the comps were from last year.
Last week, we saw the weekly purchase application data decline by 1.2%, with a year-over-year decline of 44%. The last three weeks didn’t show any weekly growth, but mortgage rates were rising for most of that period. However, that has changed recently, so it’s time for the housing market to put up or shut up for spring 2023.
This index is working from such a low bar that we need to see whether 6% mortgage rates can create some growth in this index or if we need mortgage rates to go back to 5% to create growth.
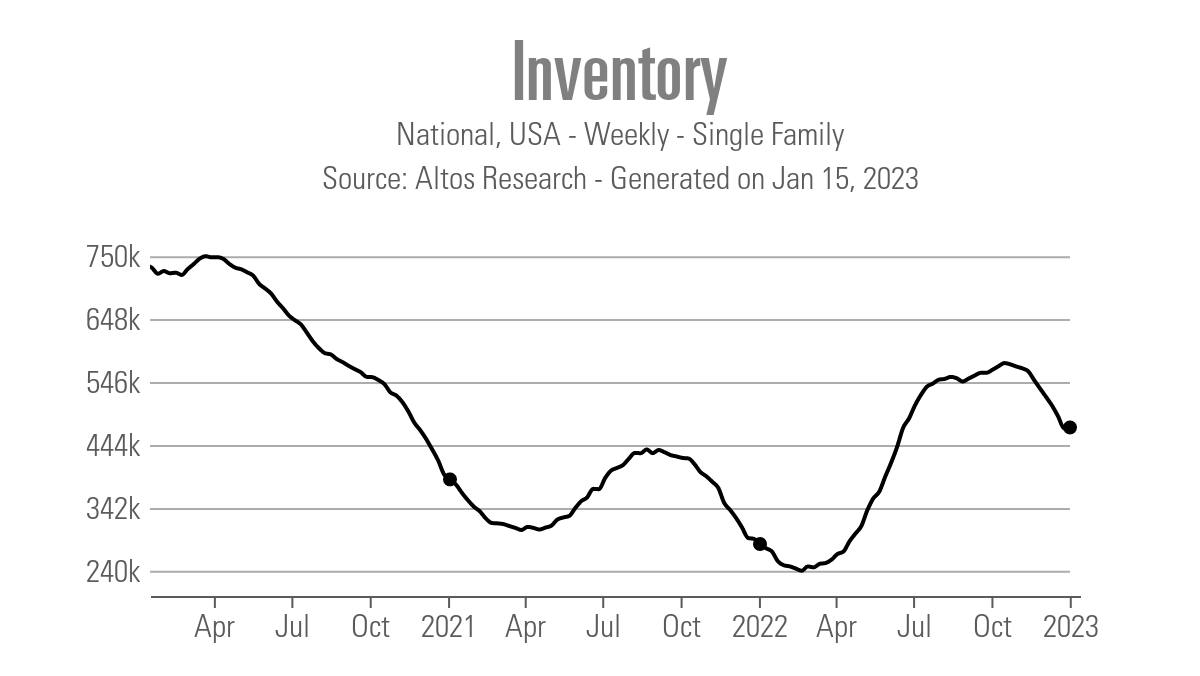
Weekly housing inventory
This data line is what I am excited about! The Altos Research weekly housing inventory data showed a slight increase in inventory over the last week, and even though it’s only 1,339 homes, it’s still a positive as the declines I was seeing early on were a bit troubling. Hopefully, we see a continuation of this inventory pick-up next week and this isn’t just a one-week blip.
- Weekly inventory change: (Jan. 6 -Jan. 13, 2023): Rose From 471,349 to 472,688
- Same week last year: (Jan. 7-Jan. 14, 2022): Fell from 292,021 to 283,656
Inventory can be tricky around a holiday, but soon we should be getting the traditional seasonal increase in inventory — a confident sign from sellers who are planning to buy another home.
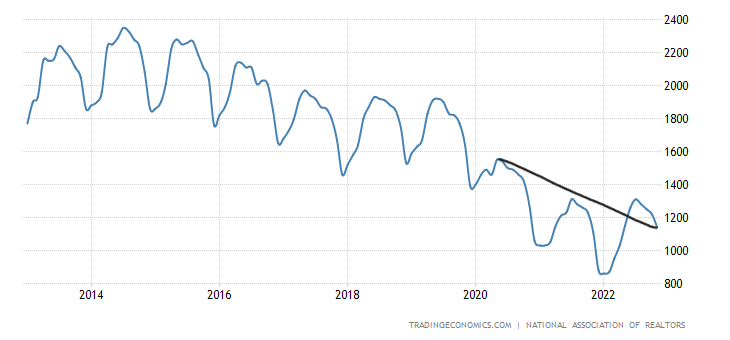
The existing home sales report comes out Friday and I expect the NAR inventory data, which lags, to show a seasonal decline. One call that I made last year about total inventory data getting back to 2019 levels — which means breaking into the 1.52 -1.93 million range — is getting harder and harder to achieve, as inventory has a shot of breaking under 1 million in the next two reports.
NAR total inventory data is currently at 1.14 million.
What I am hoping for in 2023 is more inventory, more sellers that traditionally buy homes, and for days on the market to get above 30 days again. This, to me, is a boring and balanced marketplace. This week I was encouraged to see the weekly tracker show an increase; I am just hoping it isn’t just a one-week event.
10-year yield and mortgage rates
After the jobs report came out, bond yields fell along with mortgage rates. The CPI report came out last week and bond yields fell even more. We almost broke under 6% in mortgage rates, getting as low as 6.07% on the 30-year fixed. This is good news for the housing market.
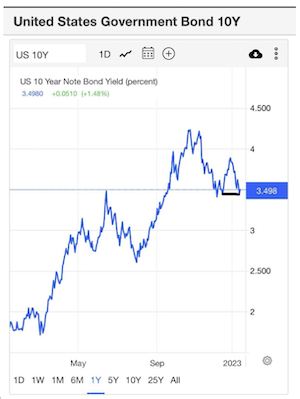
However, the one thing I wanted to see on the 10-year yield is whether we can break under this critical level between 3.42%-3.45%, and for the third time, we haven’t been able to do so. I consider this a tough line in the sand for now.
If this can break lower, yields have legs to go much lower. For now, even with positive data on the inflation front, mortgage rates haven’t been able to break under 6%.
We are also at the stage where the two-year yield will be discussed again. The importance of the two year yield is that it is tied more to short term rates, which the Federal Reserve does control. So when the Fed is hiking rates this bond yield goes up and when they’re cutting rates it goes down.
The market is telling the Fed they should be done with rate hikes sooner than they would like, and as long as this two-year yield doesn’t break out higher, the bond market is calling the Fed out. This will also be part of the discussion in the future as the Fed has hinted they’re getting closer to the end of their rate-hike cycle.
The next stage of this discussion will be when the Fed should cut rates. That most likely will happen when the labor market breaks negative. As you can see, the bond market has enormous implications for mortgage rates.
The week ahead
The purpose of the weekly tracker is to give you the most updated information on the housing market and what to look for this week. We have had a change in the housing market with lower rates, but for now, it should only be looked at as a stabilization since we are working from a deep dive in demand.
When growth is happening in the purchase application data, the data line will be clear. Nothing in the forward-looking data is showing that yet, but we are seeing stabilization now that we have nearly three months of data to work with, since rates started to fall off the highs of 7.37% on Oct. 20, 2022.
For this week, we have several housing reports: builders confidence, housing starts, and existing home sales. I am not expecting any significant changes from these, but I will keep an eye on the builder’s confidence data looking out six months as that data line turned positive in the previous report, ending the massive decline it had.
On the inflation front, we do have the Producer Price Index (PPI) report on Wednesday, which could move the bond market a little.
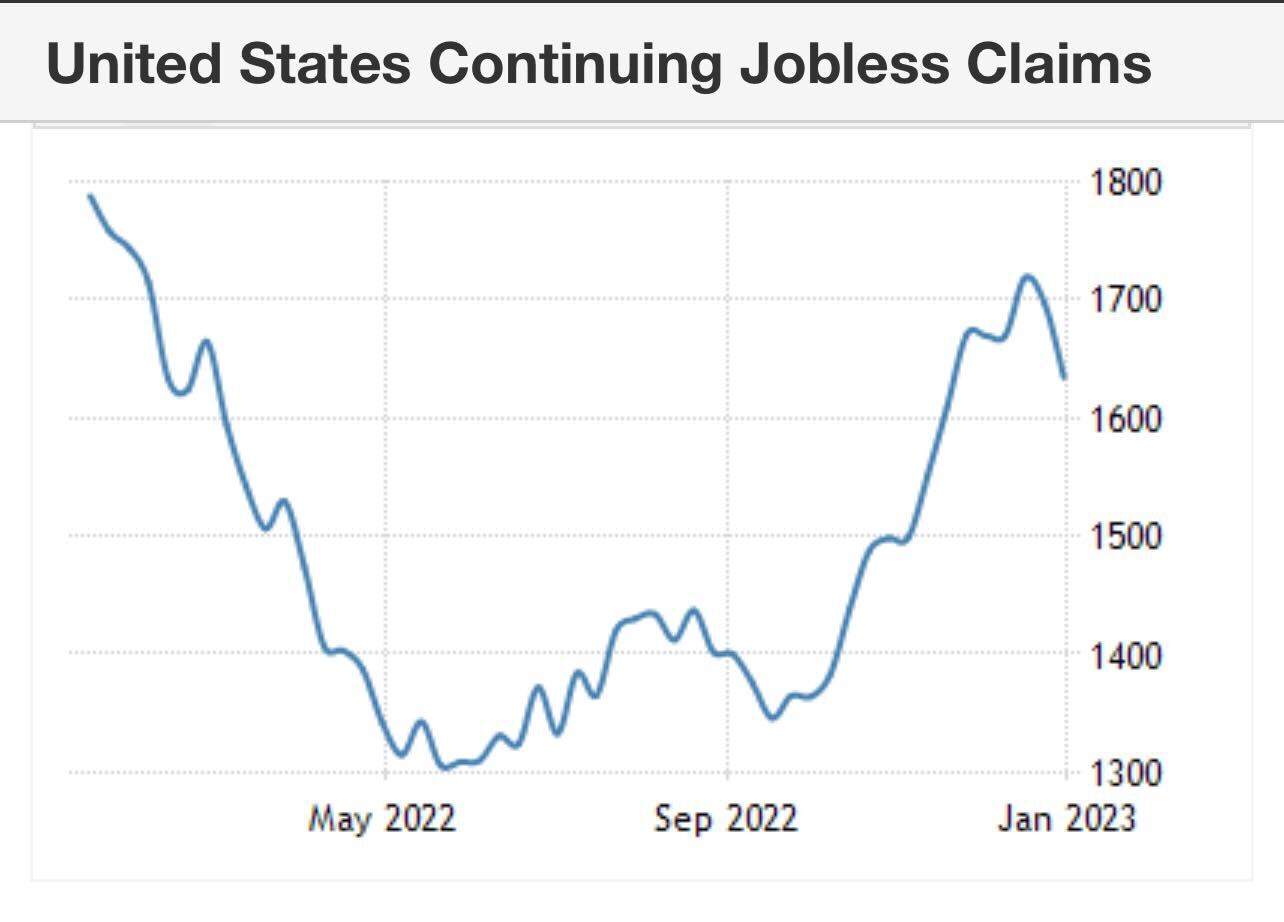
Every Thursday morning the most critical data line of the year is released: the initial claims data, which tracks the labor market’s health. For my Fed pivot to happen, the initial claims data needs to break above 323,000 on the four-week moving average. This would mean the labor market is getting much weaker and wage inflation should be going even lower.
Last week we had another solid report, as the claims data declined, which is good for the labor market. The headline number fell to 205,000, and the four-week moving average is now 212,500.
What we know now is that mortgage rates peaked in October, and the growth rate of inflation is falling, with the U.S. dollar coming down as well. These are all bullish storylines for the U.S. housing market, which took on the biggest rate shock in history in 2022.
However, rates coming down toward 6% haven’t fired the data into growth mode yet. Now, with the seasonal purchase application data in play, we will see whether these lower rates stabilize things or if we will see growth in the sales data in 2023.
For a more comprehensive view of the market, read my 2023 forecast here. Also, I’ll be part of a virtual Housing Market Update on Feb. 6 featuring Mike Simonsen, president of Altos Research, Odeta Kushi, deputy chief economist at First American, and Lisa Sturtevant, chief economist at Bright MLS.


