


We’re going to start today looking at the pending sales. Last week the National Association of Realtors (NAR) reported that existing home sales declined in June to an annual rate of 4.2 million. It’s now obvious to everyone that home prices have held up in 2023 because demand has exceeded the very limited supply of homes to buy. The question I’ve been getting lately is whether we’ve turned the corner on home sales. The number of transactions. Will the total sales rate fall below 4 million? Will it climb closer to 5 million?
NAR uses a seasonal adjustment to the data, where at Altos we simply count everything. NAR reported a seasonally adjusted annual rate in June of 4.2 million home sales in June. Will that start to grow?
Pending Sales
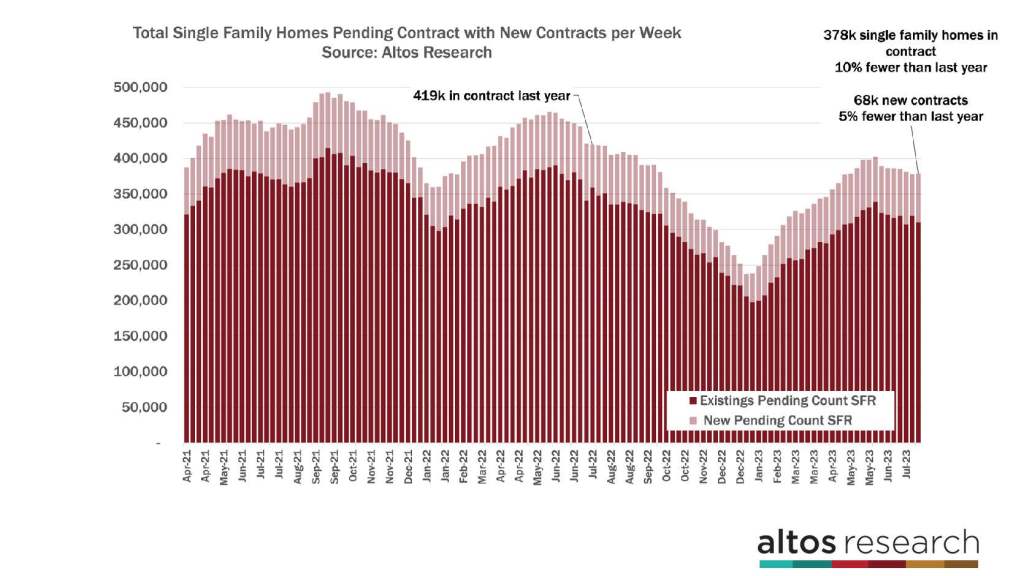
There are now 378,000 single-family homes in contract. There were 68,000 new contracts for single-family homes this week. In the chart below, the light portion of each bar represents the new contracts each week. In these videos, we focus on single-family houses and don’t include condos to keep the data clear and consistent. But, there were another 15,000 condos and townhomes that went into contract this week. The pace of 80,000 to 90,000 new sales per week translates into 4.2 million for the year.
When you think about completed sales, the pending sales that we report here are the earliest proxy for the sales that will complete in the future. Homes typically take 30-45 days in contract. When NAR reports the June sales data, these were pending sales in April and May. So if you want to see where the sales rate will be in the future, keep your eyes on this data set.
The pace of new sales is not accelerating. Home buying demand is limited by affordability of course, but this is a supply-constrained market. Even if demand picks up, the rate of sales is still going to be way under 5 million. The rate isn’t accelerating, but the comparison with 2022 is now getting easier.
In June, NAR reported that the existing home sales rate was 18% lower than 2022 at the same time. By our count, that margin has narrowed to 10% now. And the new sales rate — that is represented the light portion of each bar in the chart — is only 5% fewer than last year. So the pace of home sales is holding steady now, while it was falling in 2022.
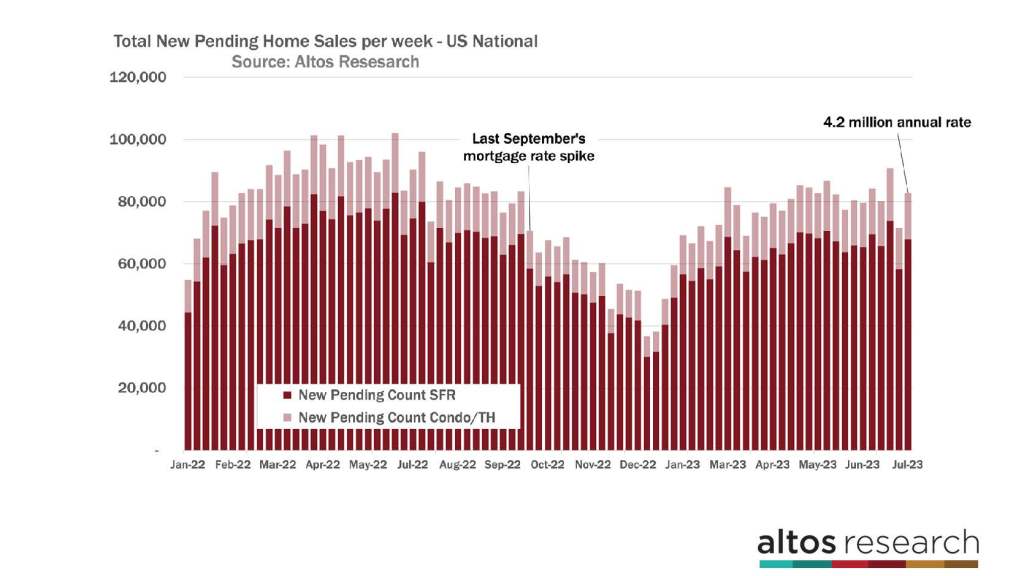
Just to zoom in on the new sales rate. In this chart, the data shows the total count of new contracts each week. The taller the bar, the more sales are happening. The dark part of the bar represents single-family homes, and the light portion of each bar represents condos and townhomes. I included condos here so you can see the total sales pace I’m referring to. With 80,000 to 90,000 new contracts starting each week, that translates right into 4.2 million for the year. In this chart, the data also shows how rapidly the sales rate fell again in September of 2022. And how steady it has been this year. So, while the rate of sales is not really increasing, the comparison with 2022 will get easier. 2024 will likely show an increase in sales too because Q1 this year was still recovering.
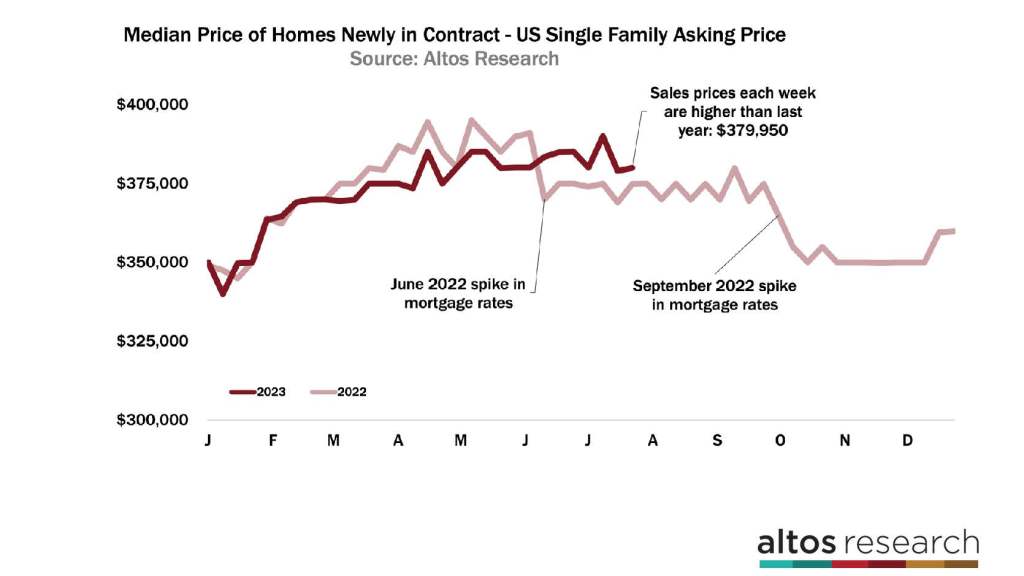
The median price of single-family homes that took offers and went into contract this week was $380,000. That’s up a tiny fraction over last week and a little over 1% higher than 2022. The trends in this chart show how quickly home buyers reacted to the big mortgage rate jumps in 2022. See the big dips in the light red line in July and September? This tells us two things: if rates jump again, consumers will react. And, by September if mortgage rates don’t jump, then the year-over-year home price changes will get much easier. You can see why home prices will likely end the year up over 2022 unless mortgage rates spike again.
I spoke with Robert Dietz the chief economist for the National Association of Home Builders (NAHB) last week on the Altos podcast, and he mentioned that they’re still of the view that last November’s peak in mortgage rates was the peak. Rates have hovered around 7% all year. The assumption that mortgage rates will come down from here is based on three things:
- That inflation has peaked and will continue to subside.
- That the economy continues to cool or go into recession and the Fed will lower rates.
- The super high spreads between the 10-year bond and the 30-year mortgage will start to return back to normal levels.
I don’t predict mortgage rates, but Dietz was very clear in his analysis, and I find that very compelling.
Inventory
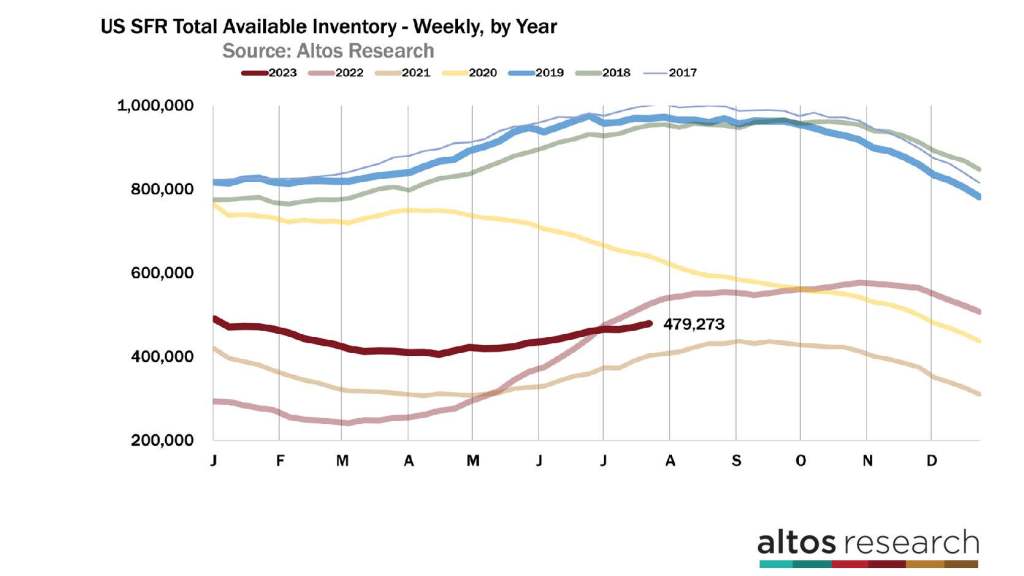
There are now 479,000 single-family homes on the market across the U.S. Each year, housing inventory typically peaks in the third quarter. If a year is a market slowdown, like 2022 or 2018, inventory might not peak until September or October. This year is not a slowdown year. Our estimation is that inventory could peak as early as next week. My guess though, is that inventory will continue to climb into late August and resemble 2021 more than say 2016. The key takeaway on inventory is that there is no signal anywhere in the data of a surge in inventory.
We’re currently projecting to end 2023 with just over 400,000 single-family homes on the market. When we started the year, our projection was closer to 600,000. That projection changes each week when new data comes in. Each surprise lower adjusts the end of year lower. We’ve had low-inventory surprises almost every week all year.
Price
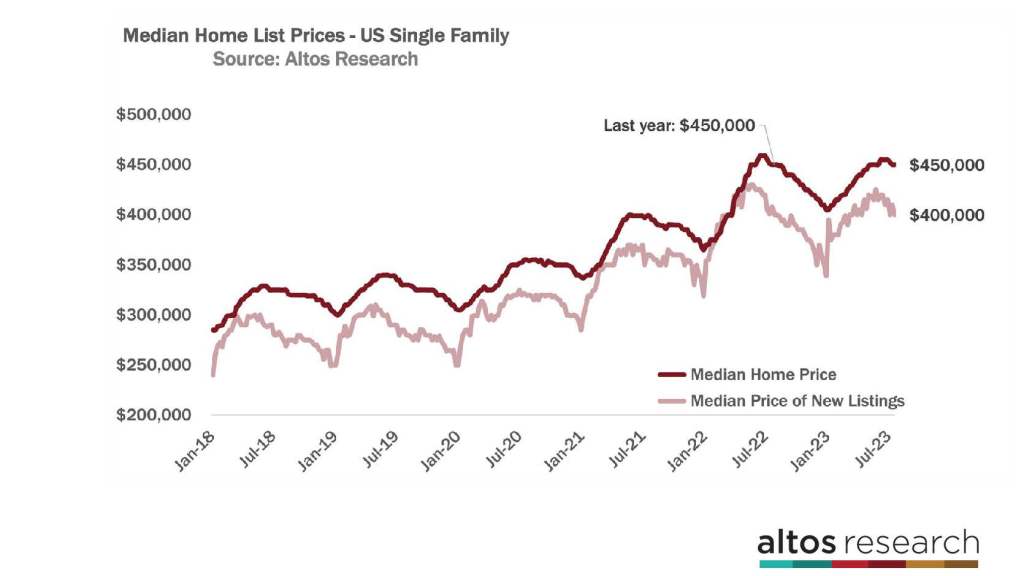
The median price of single-family homes in the U.S. is $450,000 again this week. That’s unchanged from last week and also unchanged from 2022 Last year home prices were coming down pretty quickly. In 2022, home prices peaked at a record $459,000 in early July. Home prices didn’t reach that peak again this year. $450,000 is a psychological threshold for sellers and prices tend to cluster around these big numbers. So we could see several weeks at $450,000 or $449,000 before more discounting kicks in later in the summer. Home prices should end the year at about $410,000, just a percent or two higher than the end of 2022.
The median price of the new listings is $400,000 this week. That’s down from last week. The price of the new listings is basically unchanged from 2022. Again, this is yet another signal that despite affordability challenges for so much of the country, there are sufficient buyers at these prices and these mortgage rates that home prices are not falling in 2023.
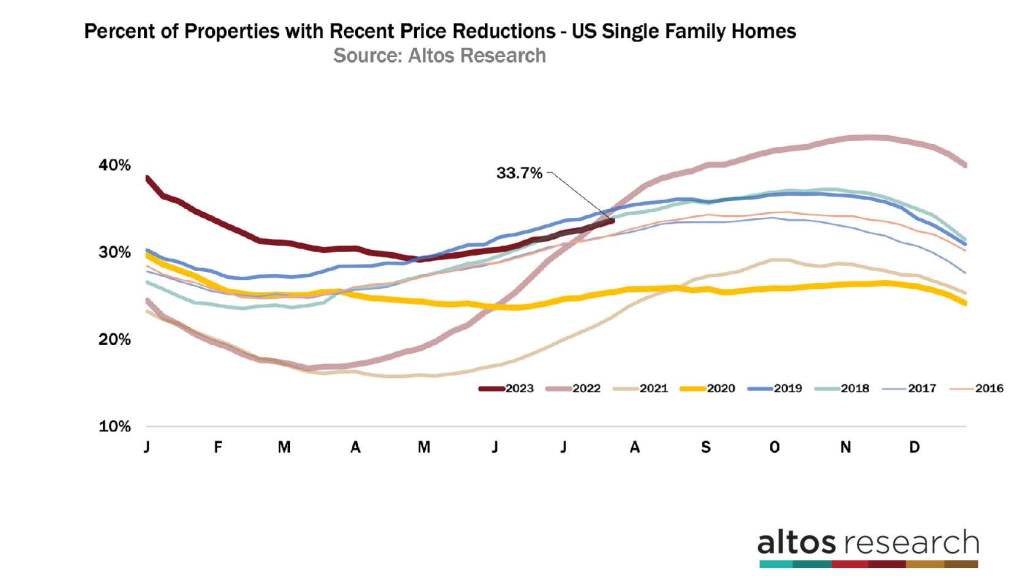
The percentage of homes with price reductions increased to 33.7%. That’s a third of the homes on the market that have taken a price cut from their original list price. Each line on this chart represents a year. You can see the annual curves that the market goes through and how it illustrates when the demand is highest, the price reductions are the lowest. I included a few more years here to illustrate how solidly in “normal” territory the market is. Balanced between buyers and sellers. The slope of the curve, how steeply it’s rising or falling, tells us if the market is shifting. 2023 is represented by the dark red line. The light red line represents 2022, and the yellow line represents 2020. Those two years are the most striking. You can see how dramatically the market changed in those years. But If you study the data closely, you’ll notice that in 2017 and 2019, the market accelerated in the second half of the year. In 2018 it decelerated. Those were much more subtle shifts but if you were selling a house in the fall of 2018, you felt it for sure.
The trend in price reductions right now is just on the slow side of balanced. We can see fractionally more price cuts when mortgage rates are near 7% than when they’re closer to 6%. Slightly fewer offers, which means slightly more price cuts for the homes on the market.
The balance in this data implies that the sales prices in August, September and October will hold up just fine. Again, buyers are mortgage rate sensitive, so if rates spike, we’ll watch the rate of price cuts increase too. You can see the jump in the light red line in September of 2022. Hopefully, Dr. Dietz is correct and rates have seen their highest watermark.


