


About this time last summer, I said it looked like the U.S. housing market could have a soft landing in 2023. Any time you use the phrase “soft landing” it should come with a trigger warning because some folks get really angry hearing it. But, I think it’s pretty indisputable now that we got a soft landing.
The market was roaring — way too hot — with bidding wars, speculators and investors who thought they couldn’t lose. A soft landing is how you end that crazy cycle without the massive pain of a market crash or bubble burst.
In the fall of 2022 after mortgage rates jumped to 7.5%, I thought maybe we’d missed the soft landing call. By October 2022, it looked like 2023 would have rising inventory and falling home prices. I grew pretty bearish again. But since January, home buyers have defied all expectations. Sellers have not materialized, and buyers have been buying everything that becomes available. Inventory has fallen all year. The peak of inventory for 2023 so far was the week of the New Year — that is insane. While home prices fell in July and September 2022, they’ve largely recovered now.
Three of the four Altos price measures are now showing positive data compared to 2022. The median price of the homes in contract is higher than last year and the new sales each week are up a few percent over last year. This is what a soft landing looks like. The froth is out of the market. There was no crash.
Could the market crash from here in the future? Of course, it could. Buyers are very sensitive, so if inflation reheats, unemployment spikes and mortgage rates jump again, then the economy fails at its soft landing and craters hard. We could see inventory from distressed sellers emerge in 2025. But that’s a long way out. So right now — soft landing.
Price
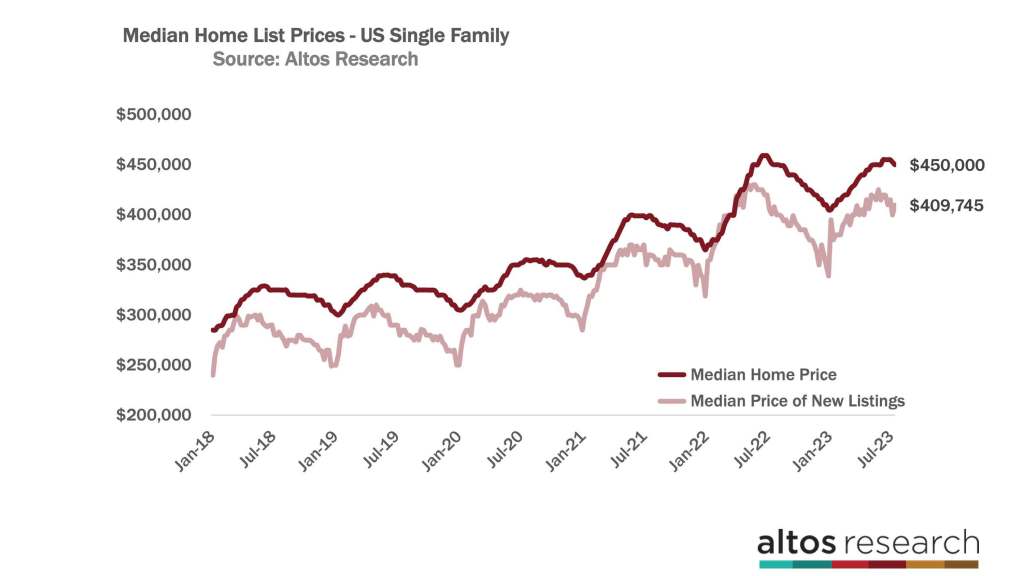
The median price of all single-family homes on the market in the U.S. is $450,000. That’s essentially unchanged from 2022. It is just a few hundred bucks lower. In the dark red line above, the data shows how rapidly home prices were adjusting lower starting in July 2022. This year, prices are past their annual peak and will decline, but in a few weeks, it looks like the market will be up year over year.
The median price of the newly listed cohort — all the homes that hit the market in the last week — is about $410,000. That’s higher than in 2022 at this time. Last year if you listed your home in July, you priced at a discount because there were no buyers. But buyers are present this year, so prices are not up year over year. In the light red line on this chart, the data shows the rapid price decline of the new listings in the second half of 2022. That seasonal decline will be less steep this year, so annual prices will increase more as the year progresses.
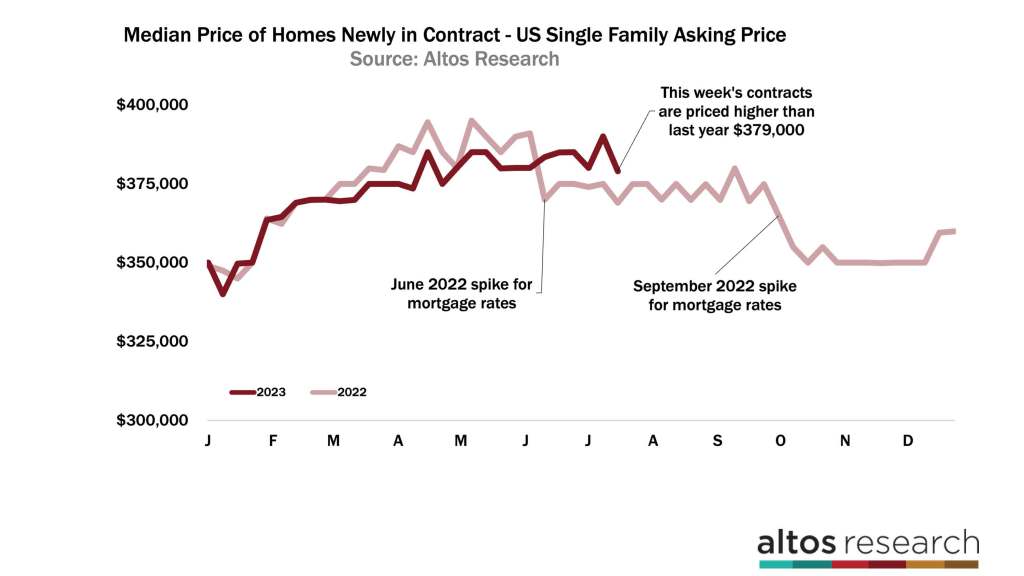
I’ve been watching the price of the new pending sales each week. This statistic is really compelling as a leading indicator of future sales. The median price of the new pending sales this week is $379,000. That’s down from last week but you can see how the home sales each week now are consistently higher priced than they were in 2022. The dark red line is the weekly curve from this year. The light red line is the curve of last year. Look at those big buyer discounts in July and September of 2022.
When I talk about a soft landing, this is where you can really see how it could get derailed. Buyers are sensitive to big jumps in mortgage rates. If I’m getting ready to buy a house, and mortgage rates jump in a week, I either hold off, or I have to buy a cheaper home. We can see the immediate impact of the mortgage rate spikes from 2022 in the price of each week’s new pending sales. The data also shows how, right now, home prices are holding up each week. Fortunately for the soft landing, inflation numbers were encouraging last week so mortgage rates fell.
Will the rest of the year continue to show price gains? As of right now, the data says yes. We can see that the homes on the market now are not taking price cuts at any unusual rate. That’s because sellers see demand at the current asking prices. Homes that are on the market now, if they don’t have offers, take a price reduction, get an offer in August, that sale closes in September or October. That data will be reported in October or November. So we can see almost through the end of the year how the soft landing home prices are holding up.
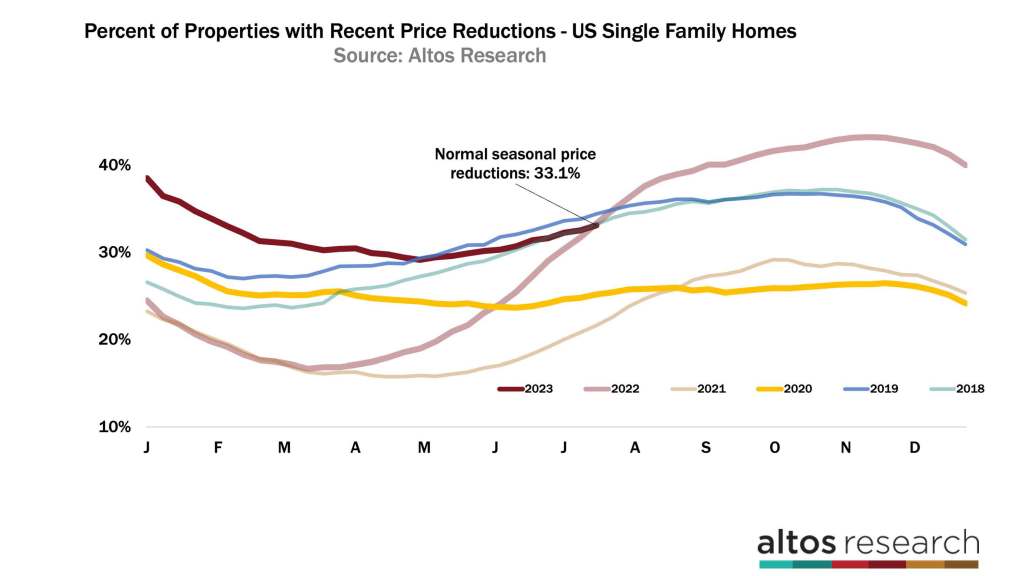
In this chart, the dark red line is the curve of price reductions through the year so far. Currently, 33.1% of the homes on the market have taken a price cut. This is a rate about the same as 2018 or 2019 for example. It shows us that demand isn’t crazy like during the COVID-19 Pandemic, but is just fine for the current level of supply of homes for sale.
As the year goes on, more homes still on the market will take a discount in order to attract buyers before the fall. There’s a normal seasonal curve here. This is what a balanced housing market looks like.
As the real estate market’s soft landing has become apparent, the housing bears have switched from fearing that home prices are tanking to pointing out that the sales rate transaction volume is way down. This is accurate. We have fewer sales now than we did a year ago.
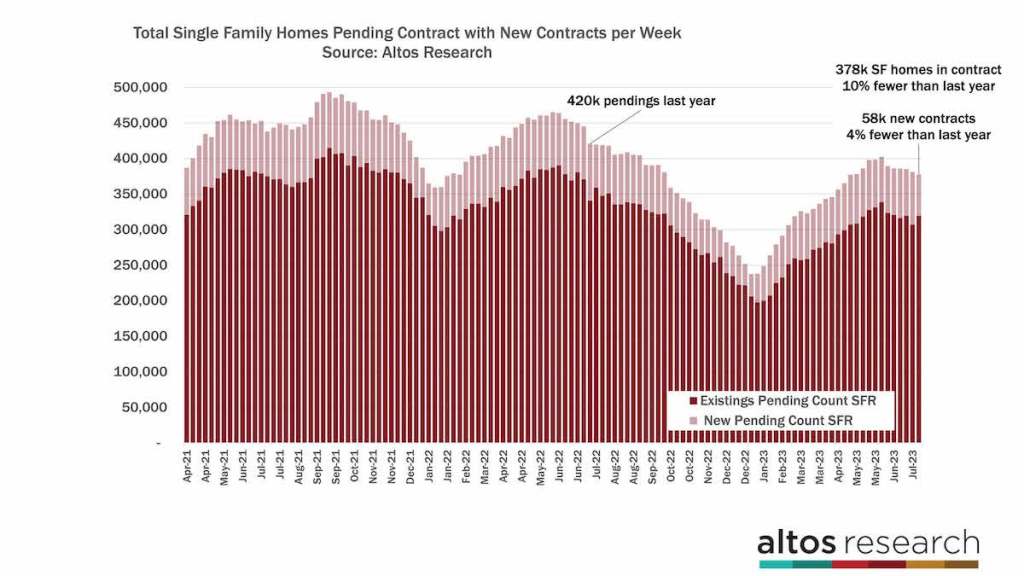
Interestingly, as part of the soft landing, the sales rate is now gradually catching up with last year. There are now 378,000 single-family homes in the contract pending stage. That’s 10% fewer than 2022 at this time and fractionally fewer than last week. We’re past the seasonal peak for sales volume, so each week we should generally see fewer pending sales.
In 2022 the market was still slowing, so while there are 10% fewer homes in contract, this week there were only 4% fewer newly into contract. Just 4% fewer buyers making offers compared to 2022 at this time. There are 58,000 new contracts on single-family houses this year compared to just over 60,000 in mid-July of 2022. We’re gradually getting closer to last year’s pace. I imagine by later in the summer we’ll be showing more sales each week than we had in 2022 at this time. Especially if mortgage rates drift lower from here.
Inventory
The second half of 2023 looks like there will be more sales on less inventory than the year prior. It’s not a lot of sales. Demand is way lower than during the COVID-19 Pandemic frenzy, and we’re so severely limited with supply that any uptick in demand doesn’t really have anywhere to go. But the end of 2022 was stopped cold and this year is warmer, on all measures. That’s what I mean when I say soft landing.
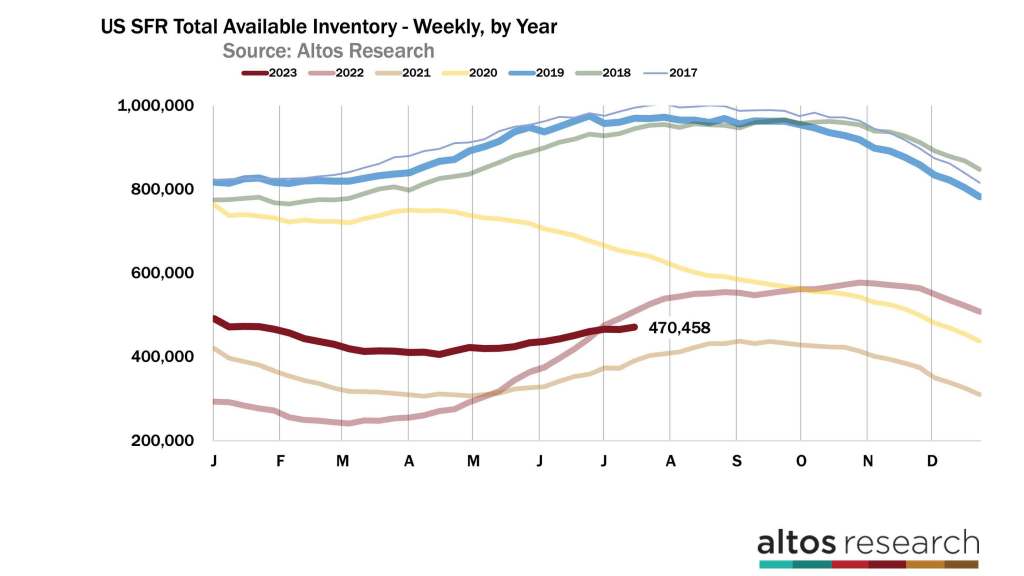
There are 470,000 single-family homes on the market now. That’s up 1% from last week. It’s 7.5% fewer homes on the market now than in 2022 at this time. That inventory gap between now and last year is growing wider every day. Even with mortgage rates around 7%, the sales rate has remained strong enough to keep the inventory in balance.
2023 began with 490,000 single-family homes on the market. What’s wild is that may prove to be the highest inventory of the year. There were more homes on the market over the New Year holiday than there are now. Most years, inventory peaks at the end of July. In the market slowdown years, for example, 2018 or 2022, inventory can keep growing later into the summer or even the fall. Sellers keep listing and buyers hold back. This year is not a slowdown year. It could be that the first week of January turns out to be the greatest inventory for 2023. That’s what a soft landing looks like.
There are some local markets that have not landed as softly as the whole country. There are some markets where demand hasn’t recovered. For example, downtown San Francisco seems to have a lot of churn still to experience. And as I’ve said before, a soft landing in 2023 doesn’t mean that home prices will never go down. That would be just silly to presume. Soft landing describes how the market has successfully transitioned from crazy hot to much more stable without going through painful over correction
Mike Simonsen is the president and founder of Altos Research


