


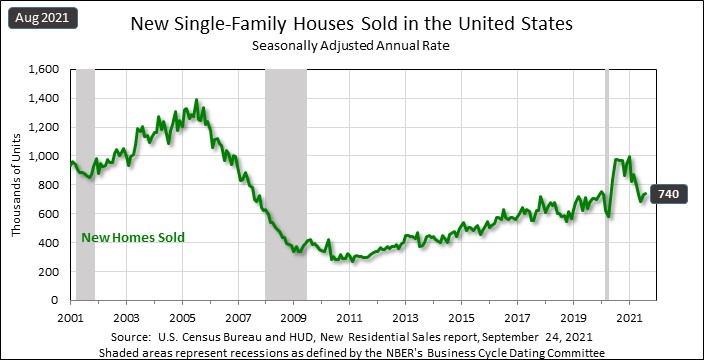
Today the Census Bureau‘s new home sales report came in as a beat of estimates at 740,000, but the most important aspect is that revisions came in positive for the prior months, which shows a more stable market as revisions are always key with new home sales and housing starts.
From the Census Bureau: “Sales of new single‐family houses in August 2021 were at a seasonally adjusted annual rate of 740,000, according to estimates released jointly today by the U.S. Census Bureau and the Department of Housing and Urban Development. This is 1.5 percent (±15.1 percent)* above the revised July rate of 729,000, but is 24.3 percent (±19.1 percent) below the August 2020 estimate of 977,000.”
The monthly supply data — which I focus on more than any other housing data — came in at 6.1 months and the three-month average is running at 6.06 months.
We have seen a noticeable pick up in the monthly supply data for the new home sales sector. Before this report, the monthly supply data got to 6.2 months before the slight fall this month to 6.1 months
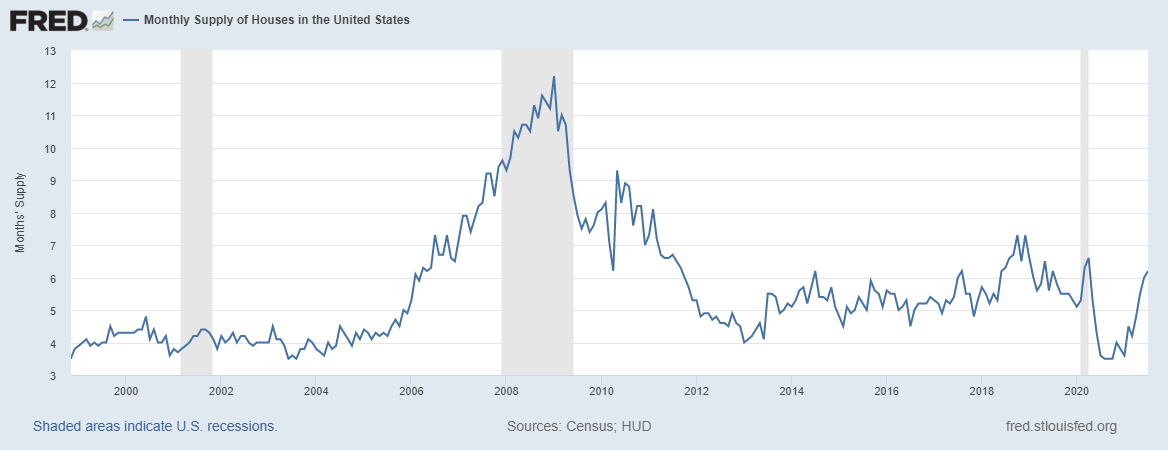
However, with the positive revisions now in sales in back-to-back reports, the sector has stabilized for now. As long as the monthly supply data on a three-month average doesn’t go above 6.5 months, I don’t need to put the new home sales market into the penalty box.
My rule of thumb for anticipating builder behavior is based on the three-month average of supply:
- When supply is 4.3 months, and below, this is an excellent market for the builders.
- When supply is 4.4 to 6.4 months, this is an ok market for the builders. They will build as long as new home sales are growing.
- When supply is 6.5 months and above, the builders will pull back on construction.
My theme of moderation in housing data, which I have talked about since the summer of 2020, was to guide people in 2021 to not overreact to moderation data in a big negative way. Housing data tends to be sticky because the demand for shelter is needed each year, it’s not like the stock market. So, unless you have a massive credit boom as we saw from 2002-2005, it’s extremely hard to have a collapse.
However, the previous expansion had the weakest housing recovery ever in new home sales and it was running into the best housing demographic patch ever in the years 2020-2024. When housing was waving a red flag in 2018 when mortgage rates hit 5% and monthly supply data went above 6.5 months, this was what I wrote then when some people were saying housing had peaked.
“Despite the terrible optics for the new home sales market, I caution everyone not to assume that we have hit our peak and are heading for an epic crash in housing starts and new home sales. New home sales and starts are still very low.”
New home sales and housing start data can be wild month to month, so the revision trends are key. I am never going to be the housing sales boom or boom construction guy. I am a big believer in built-in demographic replacement buyers and this is why housing has done well in 2020 and 2021. People need shelter and sale levels for both new and existing homes aren’t screaming speculative demand at all. Slow and steady wins the race and a balanced market is always the best one. Now we have seen the moderation in new home sales, existing home sales, housing permits and the builders’ confidence.
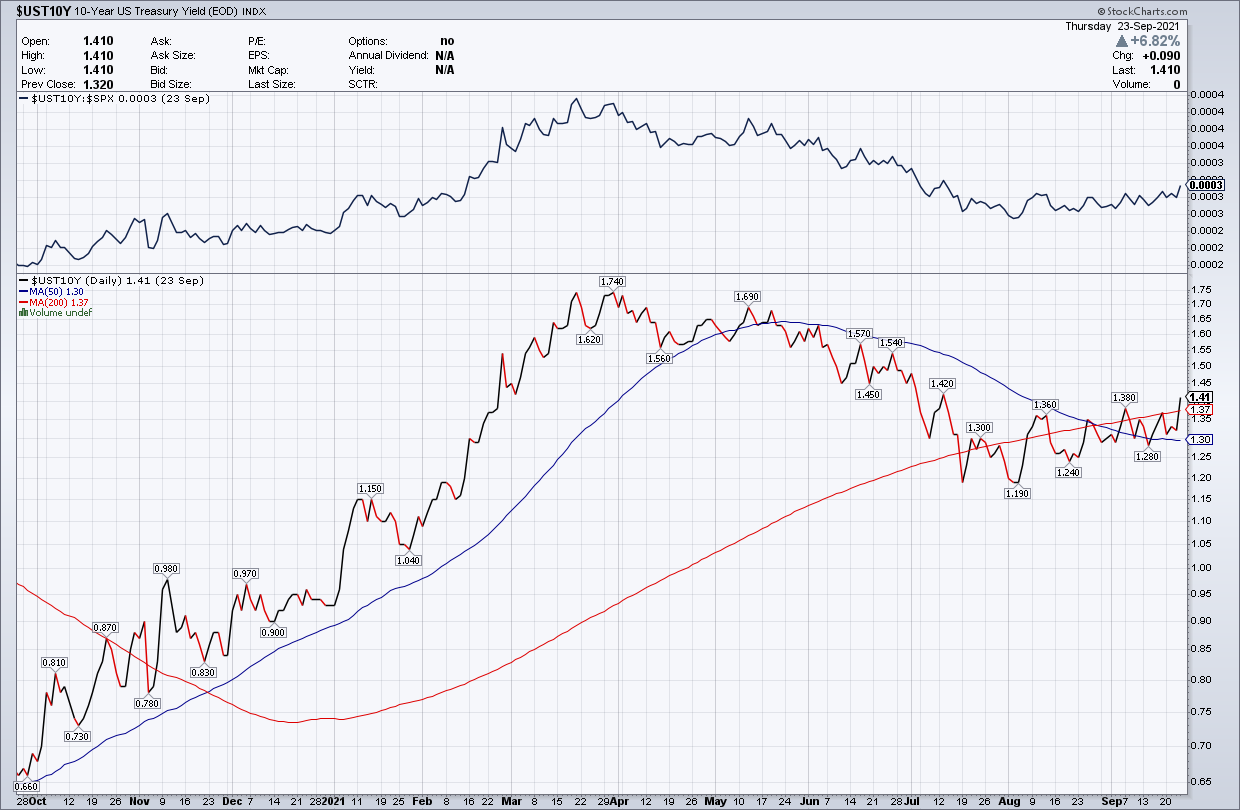
The one thing about the new home sales sector is that it does get impacted by higher mortgage rates more than the existing home sales marketplace. We have seen a recent uptick in bond yields and mortgage rates should go higher with it. However, just as I wrote last year, the housing discussion can change with rates but it needs the 10-year yield to go above 1.94%, which means rates over 3.75%.
That is something I didn’t believe could happen in 2021 as my 10-year yield range forecast was 0.62% – 1.94% and the upper-level range for mortgage rates was only 3.375% -3.625%.
Always remember when we have weaker economic data or a bad headline from some real estate company in China, in theory, it would drive bond yields lower. Most people with common sense know that the Chinese Evergrande saga doesn’t really impact the U.S. economy or the housing market. We saw a nice sell-off in bonds with stocks rebounding as these mini-drama events don’t have much staying power.
We have to remember that the U.S. economy is really driven by domestic demand data, as most of our workers and consumers move not with events overseas but what only happens in America.
(A recent podcast interview that I did gives context into how I look at economics and what has happened in 2020 and 2021. See here.)
It was a big week of housing data and all in all, a good week as things have moderated and stabilized in housing data. For me in 2021, finding a good base for home sales data to work from was always going to be key because what happened toward the second half of 2020 in housing data was a once-in-a-lifetime event and people might have had a wrong impression on where sales were trending. That was all make-up demand from the pause of COVID-19 and now moderation in the data has worked itself to a more stable area.
Unfortunately, a lot of housing bears in America simply don’t have the training to read data correctly and some have some a strange obsession with a housing crash. I always like to say some people ice skate uphill. Have a great weekend everyone and hope to see some of you at the 2021 HW Annual event in Frisco, Texas on Sept. 27-28.


