


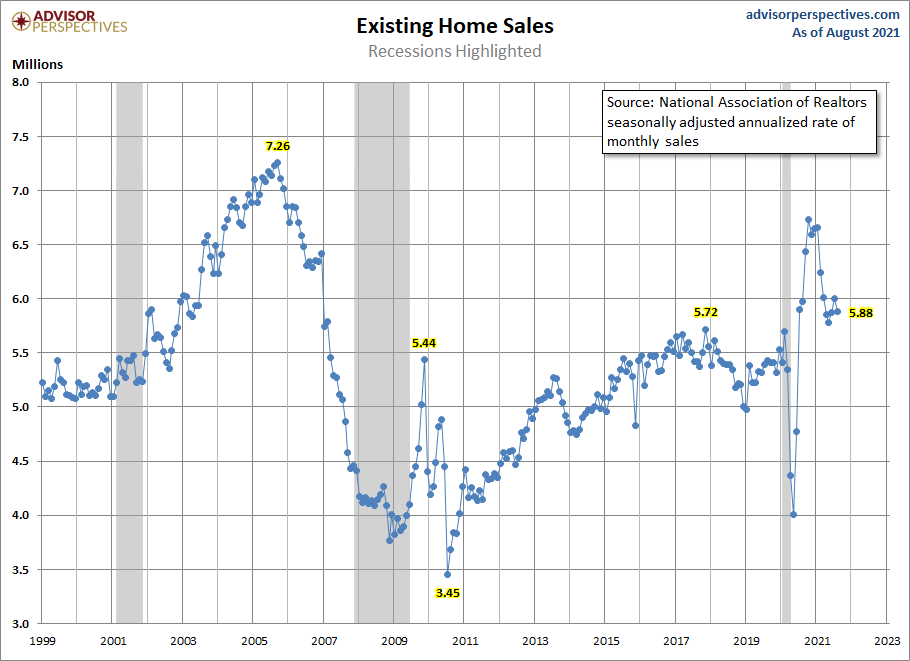
The National Association of Realtors reported existing home sales for August came in at a very tiny beat of estimates at 5,880,000. Now that we are a few days away from October, we can again say that the housing bubble boys and the forbearance crash bros have whiffed just as severely in 2021 as they did in 2020.
So far this year, every existing home sales print has been higher in 2021 than the closing level of sales in 2020, which was 5,640,000. Even with the unhealthy home price gains that we have seen in the last two years, more Americans have bought homes with mortgages in 2020 and 2021 than any single year from 2008-2019, and this looks perfectly normal with our current demographics.
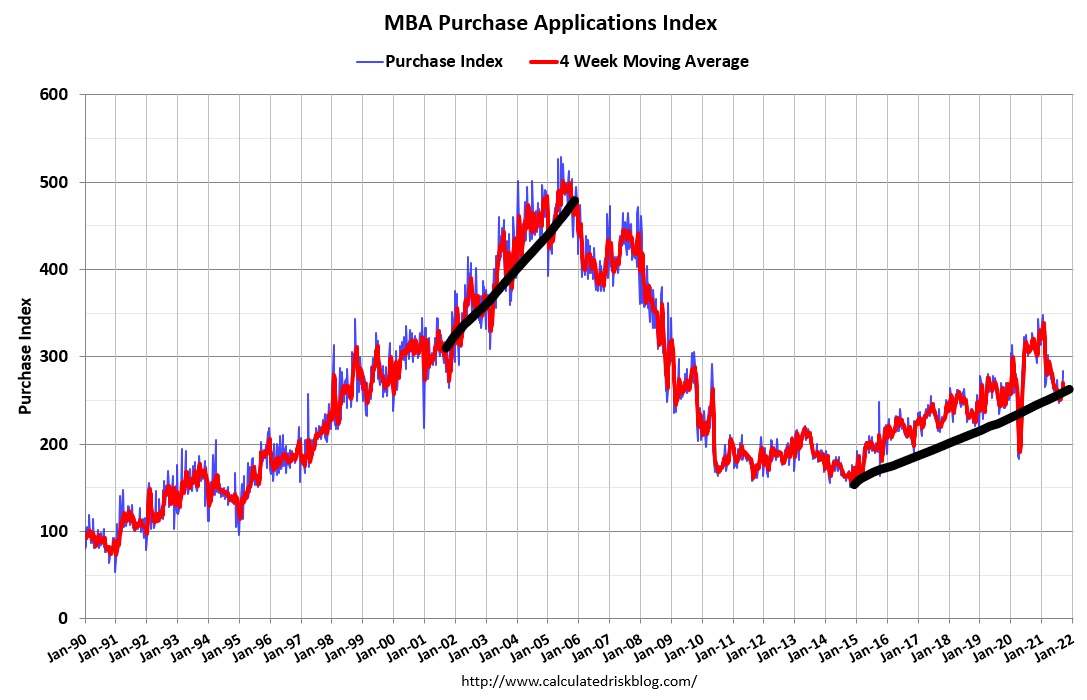
The key to understanding why housing has done well in 2020 and 2021 is to realize that the previous cycle from 2008-2019 was the weakest housing recovery ever. New home sales, existing home sales, housing starts, mortgage debt demand all had a slow recovery. Nothing about the previous expansion is screaming overheating demand, as you can see below with the purchase application data which came out today.
What we saw from 2002-2005 will not happen again as we will never see a credit boom like that with our lending standards today. Regarding purchase application data, it looks like volumes are picking up again, which typically doesn’t happen after May. I wouldn’t look at the recent pick-up as a surge in demand but more that the data is just staying firm.
COVID-19 has distorted many housing data lines, and we will still have this distortion in purchase application data until mid-February 2022. I would look at the recent pick-up in purchase applications more as the stable housing demand story. This is a forward-looking indicator of 30-90 days. In short, demand looks to be stable for the rest of the year, and we have more inventory now than we had to deal with earlier in the year.
Regarding the 2021 sales demand trend for the existing home sales, the demand trend looks about right to me. Early in 2021, I talked about that sales trends should be in this range if we were going to have a good year. “The rule of thumb I am using for 2021 is that existing home sales if they’re doing good, should be trending between 5,840,000-6,200,000. This, to me, would be considered a good year for housing.”
However, I had anticipated some existing home sales prints under 5,840,000 this year, and so far, we have only gotten one of those. We don’t have many reports left for the year, and a little housing secret that many people still don’t know is that we had some of our best monthly housing prints happened in the fall and winter in the previous expansion.
Of course, last year, housing was distorted by the COVID-19 make-up demand, but our best prints came with pumpkin spice latte and New Year’s resolutions in the previous expansion.
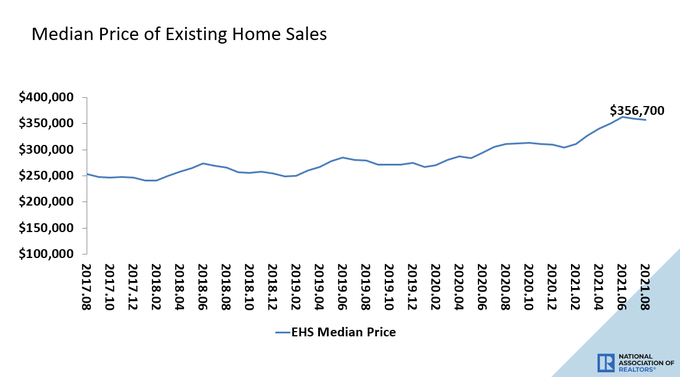
Regarding home price gains, I have kept saying this is the unhealthiest housing market post-2010, but not because of a massive credit bubble. A shortage of homes had created too many bidding wars, thus pushing price growth much higher than we saw a few years before 2020 and 2021 came.
According to NAR Research, “The median existing-home price for all housing types in August was $356,700, up 14.9% from August 2020 ($310,400), as prices increased in each region.”
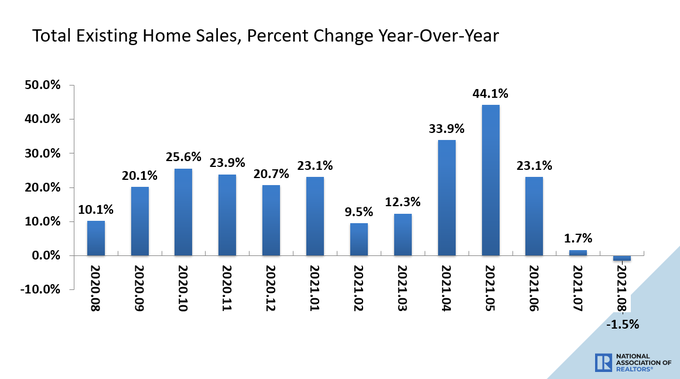
Today’s existing home sales report showed negative 1.5% year-over-year growth in demand. Hopefully, by now, if you have followed my work, you would know to ignore year-over-year data this year as COVID-19 has done a number on year-over-year comps. Just as you should have ignored the highly positive prints early in the year, you need to forget the negative year-over-year data that will be common in home sales data for many months because the comps from the makeup demand last year are way too high and not normal.
I am sure some housing bears will jump on the negative year-over-year data just like they jumped on the negative year-over-year data on purchase application to push for the second-half crash in housing in 2021. Let’s just say it didn’t end well for trolling crash housing YouTube.
From NAR Research: “Year-over-year, sales dropped 1.5% from a year ago (5.97 million in August 2020).”
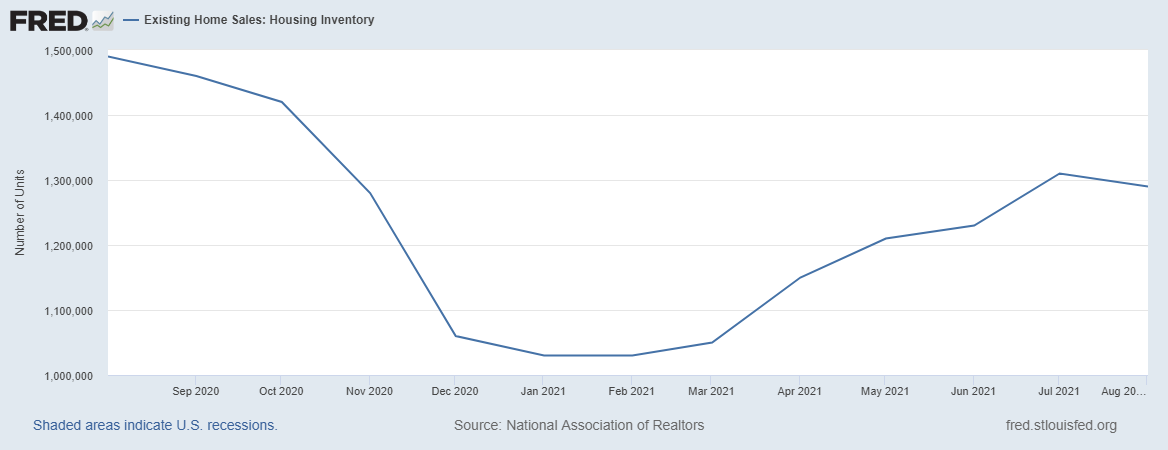
One of my big themes for the rest of the year in housing is that I would love to see recent inventory gains that we saw stick and go higher in 2022. This will cool down the bidding wars and price growth.
However, the major problem with that is the seasonality of inventory. Inventory typically falls in the fall and winter and picks up in the spring and summer. Well, so far, this report isn’t encouraging as we see some indication of seasonality happening. However, it’s the months of September to December when this becomes more transparent.
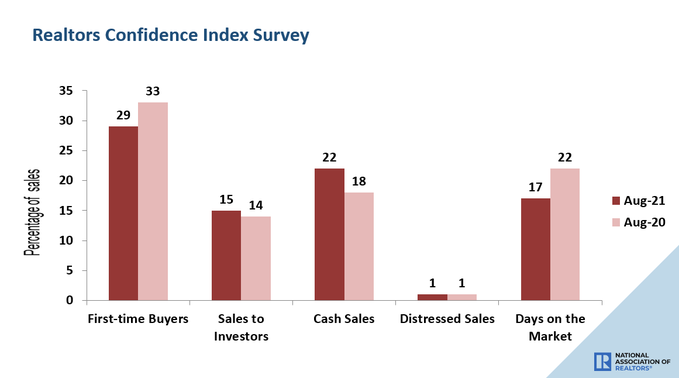
The No. 1 data line that I want to see is a rise in the days on the market. Anything with a teenager print is unhealthy, and we want to see this data line rise so Americans have more choices of homes to buy and home-price growth cools down. I already have gone past my cumulative home price growth peak levels of 23% that I laid out for 2020-2024 in just two years. Naturally, I am rooting for a much cooler home price market to regain some balance in this marketplace.
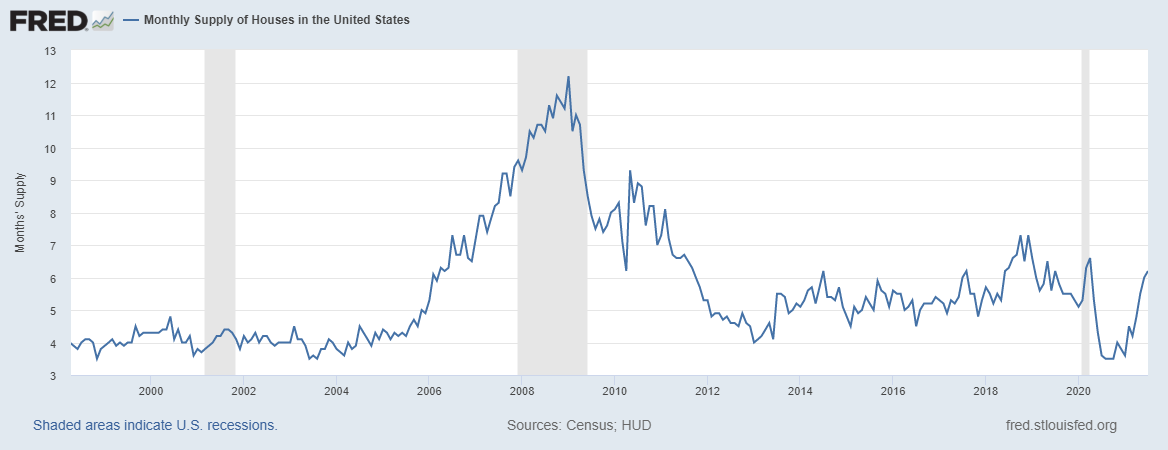
Another thing to note is that there is all this talk about investors being a big part of the housing market and yet, today, once again, we do not see much year-over-year growth. The previous report didn’t show any growth year over year either. Don’t forget that primary resident mortgage buyers drive housing; when they fade, so does housing. The U.S. housing market doesn’t have an invisible Wall Street moat protecting it. We have limits on demand, and when rates rise to a certain level, it will cool down housing much like it did in the previous expansion.
From NAR Research: “First-time buyers accounted for 29% of sales in August; Individual investors purchased 15% of homes; All-cash sales accounted for 22% of transactions; Distressed sales represented less than 1% of sales; Properties typically remained on the market for 17 days.”
I always remind people that the existing home sales market’s inventory situation is much different from what occurs in the new home sales market. Inventory levels have been increasing more in the new home sales market but are still at levels where housing starts can grow, as we saw in yesterday’s housing starts report.
The new home sales report is coming out on Friday, and this is the data line to always keep an eye out for with a three-month moving average.
All in all, it was a decent report today, but in reality not much is happening in the existing home sales market regarding demand. It was always trying to find a base to work from after the massive make up demand that we saw in the second half of 2020.
They key thing to take away from the existing home sales market this year is that demand is stable, even with the massive price gains we have seen in 2020 and 2021. We don’t have a booming sales market like what we saw from 2002-2005, we have stable, demographically built in replacement demand in years 2020 and 2021 and that looks perfectly normal to me.


Great stuff as always Logan. Thank you for sharing.
Excellent read, keep it coming.