


Today, pending home sales came in as a big beat of estimates — up 7.5% in October — and since we are days away from December, we can officially label the 2021 housing crash bears as even worse than the 2020 housing crash bears. Like I have often said, professional grifters have plagued the housing sector for many years and shouldn’t be looked to as fundamental economic sources of information. This is a big reason why I always have my two staple sayings.
“Economics done right should be boring“
Trust me, in this day and age of the seven-second attention span, promoting doom and gloom, housing crashes and vast economic conspiracies is the best way to get clicks. I do understand that my economic takes and charts might not be the sexiest thing on the internet. However, I still believe that economics is a story best told by numbers and not ideological takes. Believe in people who believe in economic models, even if they’re not exciting.
“Always be the detective, not the troll“
As you can imagine, being a very pro-American economic person, especially during this crisis, I have a target on my head. People like myself understand that it’s part of the business. Who is crazy enough to write an American economic recovery model on April 7, 2020, and try to explain to people why housing isn’t going to crash due to demographics, good credit profiles and low mortgage rates? What person would be so confident in 2020 that forbearance wasn’t going to crash housing in 2021 that they would create the term Forbearance Crash Bros to be ready to mock this group in 2021?
Whatever the future brings for the U.S. economy, know that I won’t lie to you for clicks; it will be based on boring economic models that are back-tested in time and adjusted for new variables 24/7. You can glimpse my mindset in this podcast, which covers the entire COVID-19 crisis and housing. The title I do believe is fitting: Bear Crusher.
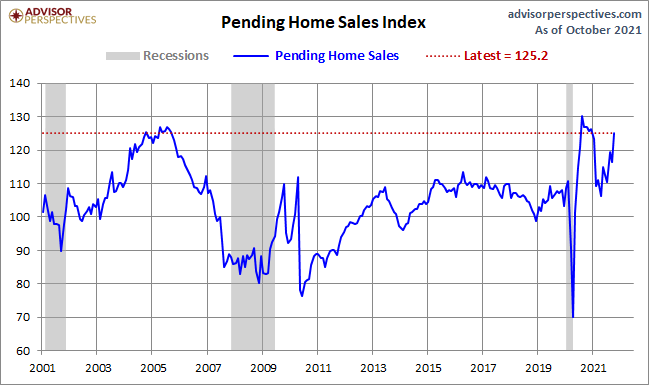
From the National Association of Realtors: “The Pending Home Sales Index (PHSI), a forward-looking indicator of home sales based on contract signings, rose 7.5% to 125.2 in October. Year-over-year, signings fell 1.4%. An index of 100 is equal to the level of contract activity in 2001.”
One of the themes that I wanted to give to my readers is that housing data had surged toward the end of 2020, which created a high that couldn’t be sustained. Home sales had a big gap from trending sales to where total sales closed in 2020. So, what was always going to happen was that housing data would moderate. That moderation will be viewed as housing crashing because I have seen people use this line repeatedly during the last eight years. This is why I recently wrote about what real housing or economic weakness would look like so you don’t get suckered by housing and economic crash addicts.
As we can see below, housing moderated, found a base and moved higher toward the second half of 2021. I stress this as many people had sent me examples of YouTube videos with people touting a second-half housing crash. I can tell you that these people don’t have the training to read housing or economic data correctly. If they did, then the notion of a sales collapse in 2021 — when trend demand data was always showing stability — is ludicrous. Remember, be the detective, not the troll.
Last week, I wrote about how the existing home sales markets outperformed my peak sales range in the past two sales reports. As long as the final two reports of the year are above 6.2 million, you should see that as a beat. Of course, total sales are above my critical level of 6.2 million when adding new home sales. So far, 2020 and 2021 have come in as a noticeable beat in my eyes. Mother Demographics and low mortgage rates are two very hard competitors to go against when advocating an epic housing crash.
From NAR: “Motivated by fast-rising rents and the anticipated increase in mortgage rates, consumers that are on strong financial footing are signing contracts to purchase a home sooner rather than later,” said Lawrence Yun, NAR’s chief economist. “This solid buying is a testament to demand still being relatively high, as it is occurring during a time when inventory is still markedly low.”
Has anyone noticed that over the last eight years everyone blames low inventory when we miss estimates, but they keep quiet about it when sales are beating estimates, while inventory is still falling? Over the years, I have never believed in the premise that low inventory is holding sales back, which was expected whenever sales get weaker. 2020 and 2021 are at pre-cycle highs in demand, with total inventory levels at all-time lows for both years.
Remember, a seller is typically also a buyer, so inventory should fall when demand picks up and that seller finds another home to buy. When inventory rises and more supply is on the market, this means demand is fading. Total inventory levels have been falling since 2014, while sales have been rising. Please don’t forget this in the future, as sales will slow at some point when mortgage demand fades.
From the NAR: “The notable gain in October assures that total existing-home sales in 2021 will exceed 6 million, which will shape up to be the best performance in 15 years.”
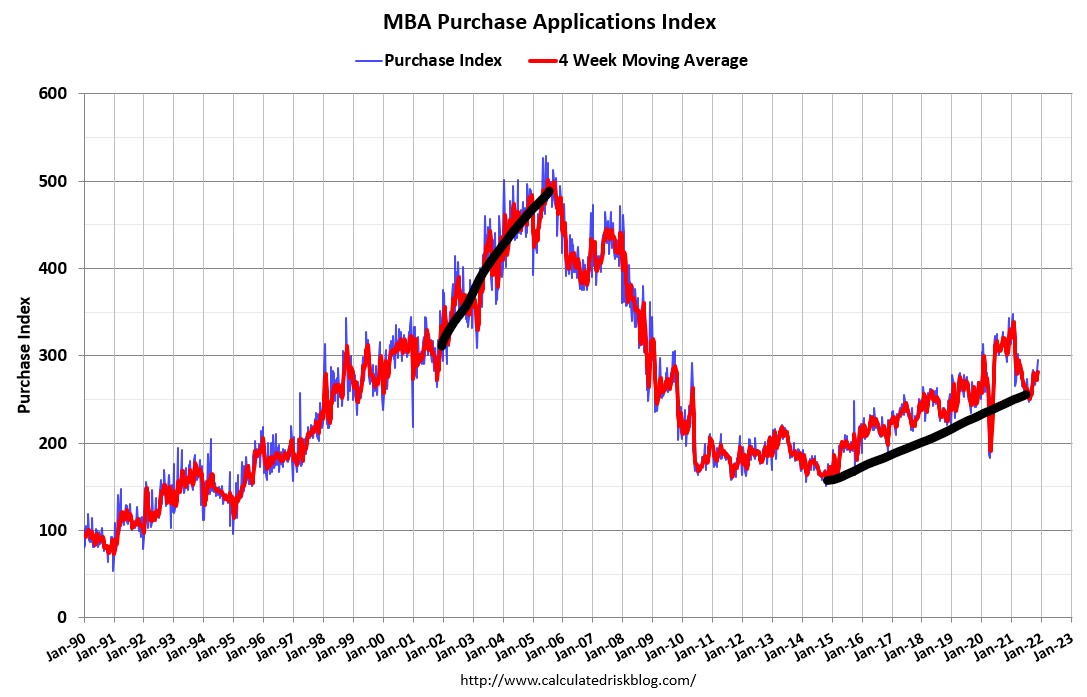
One aspect of housing that doesn’t get enough attention is that mortgage purchase application data has had a nice run for 12 weeks. Earlier in the year, I wrote an article saying that purchase application data was going to be negative year over year in the second half of 2021, and we shouldn’t overreact to this, because the housing crash people will.
It’s the nature of the beast, as I have seen this behavior a lot. The lack of training and not making COVID-19 adjustments to data creates a false sense of reality for housing crash people, and some were pushing the negative year-over-year data as a legit premise for sales to collapse.
Well, as we can see, sales didn’t collapse, but something else happened. The purchase application data was getting better because the year-over-year declines were improving so much that we have a shot to report even a flat or positive print, which will explode my head. Not even I thought that could be possible with such high comps, as we can see below with mortgage demand getting firm.
From July 14 to Sept. 8, purchase application data year over year was trending at roughly negative 18%-19%. The higher comps in 2020 were always going to result in negative year-over-year data this year. However, just taking the last eight weeks, still using high comps, the average decline is roughly 8%-9%. The last three weeks combined is down only 4.6% on average, and this data line looks out 30-90 days.
Yes, seasonality kicked in a while ago, but the firming of this data line is a big deal. Consider this in the context of the focus on iBuyers, which might not even account for 1% of total home sales. The focus has also been on investors because the premise was that without investors, housing would crash. This idea misses out on the real data trends that matter because the biggest homebuyers in America are always mortgage buyers, not investors. We don’t have a Wall Street moat around housing: when mortgage demand fades, so will housing.
Hopefully my work this year can make you understand that sexy ideological headlines might get the press time, but good old boring economic work gets the job done with satisfaction. Today’s pending home sales is just another affirmation of what we’ve seen over the last two years: it’s the Revenge of the Nerds.


Always great to get your daily, boring reports, Logan. It’s how I start my day: Coffee + Logan’s articles on Housingwire! Cheers.