


[Editor’s note: As of November 2022, we no longer use Slack, and we’re happy to share that we’ve moved to Circle for our new community platform. We will be continuing Q&As, live discussions and more in this new community platform. If you’re a member and not a part of our Circle community yet, you can click the link at the end of the article to join.]
In this HW+ Slack Q&A, HousingWire Lead Analyst Logan Mohtashami answers questions from our HW+ member community. Mohtashami focused on the latest inventory and the Federal Reserve’s rate hike announcement.
As a member of HW+, you get access to 30-minute Slack Q&As, where we invite the HW Media newsroom to break down the hottest topics in the industry. This Q&A was hosted in the HW+ Slack channel, which is exclusively available to members. To get access to the next Q&A on June 29th, you can join HW+ here.
The following Q&A has been lightly edited for length and clarity. This Q&A was originally hosted on June 15th.
HousingWire: Since purchase application data is still the hottest topic, what is the current data looking like?
Logan Mohtashami: Purchase application data:
- +8 week to week
- -16% year over year
- The 4-week moving average is -16.75%
I had anticipated 18%-22% YoY decline trends with rates this high after the price gains. We aren’t there yet but heading in that direction.
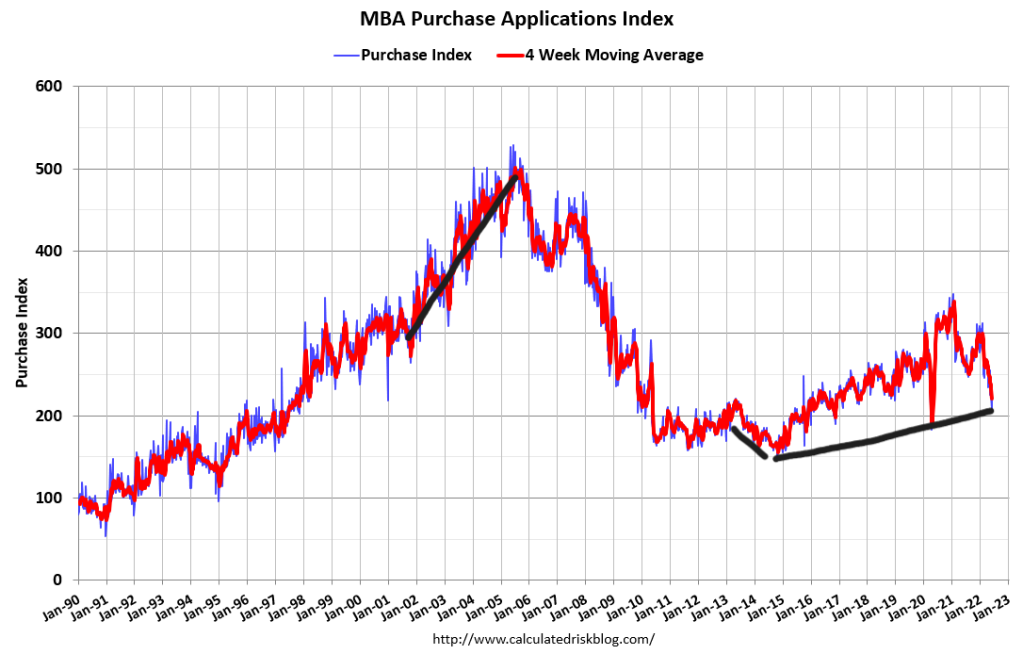
Starting in October we will be having harder comps so, if this trend continues, we will be seeing 25%-35% year-over-year declines. Some historical context with previous rate increase moves in this data line.
In 2013-2014, when rates jumped very fast, this index trended down by negative 20% year over year to hit an adjusted population all-time low in 2014. In 2018, when rates got to 5%, this index was primarily flat to positive year over year, with only three mild negative year-over-year prints. When this index moves positively and negatively, it’s up or down 20%-30%. We are going to have more challenging comps starting in October.
A look at what happened in previous times when rates rose: demand always declines, and with 4%-5% rates it looked like a standard higher-rates-hit-demand trend. Now at 6%+, we shall see how much damage that does after the significant price gains since 2020.
2022 purchase application data will be the first year where this index has declined since 2014. As long as we see year-over-year decline trends, demand will keep falling with it.
HW+ Member: We’re expecting a Fed announcement in less than an hour. What do you expect to hear? How will the announcement impact mortgage rates? What’s priced in?
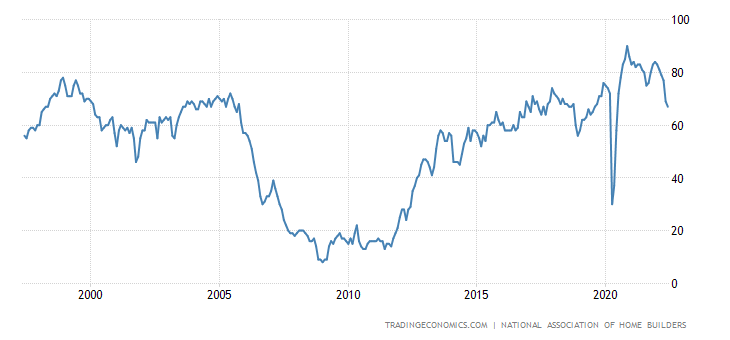
Logan Mohtashami: Fed Day Is Here! Bond yields have made a massive move higher before this meeting, and now people have priced in a 0.75% rate hike. So the bond market has always got ahead of the Fed rate hikes in terms of pricing, and the Fed is playing catch up! Except, we have more interesting data for the Fed to think about. The Builders Survey data is falling big time, before the current higher rates; this is one of my last two out of six recession red flags that can be raised before I go on full recession watch.
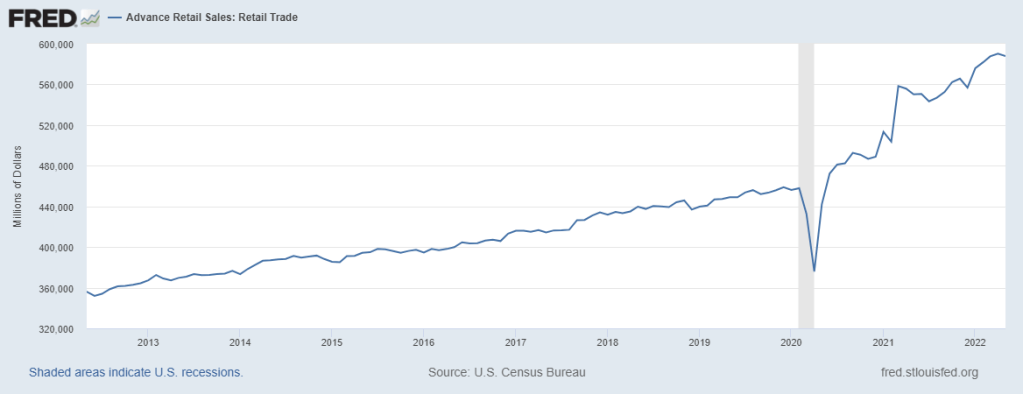
Retail sales also came in a bit lighter than expected:
HW+ Member: Are you implying that the builder survey and retail could influence the Fed to come off the 75 bps guidance?
Logan Mohtashami: So, The Fed will hike, but it will be interesting to hear what they say, because Q2 GDP is tracking flat; this means on a growth basis, we are going to have back-to-back negative GDP.
If they hint that this is on their minds, bond yields can retrace and head lower giving better pricing for mortgage rates. Some of the economic data today shows a more significant slowdown than in the past few months, which can carry over to lower their core PCE growth concern. They will be asked this question today! The last time I had four of my six recession red flags up it was 2006 and the other two came that year.
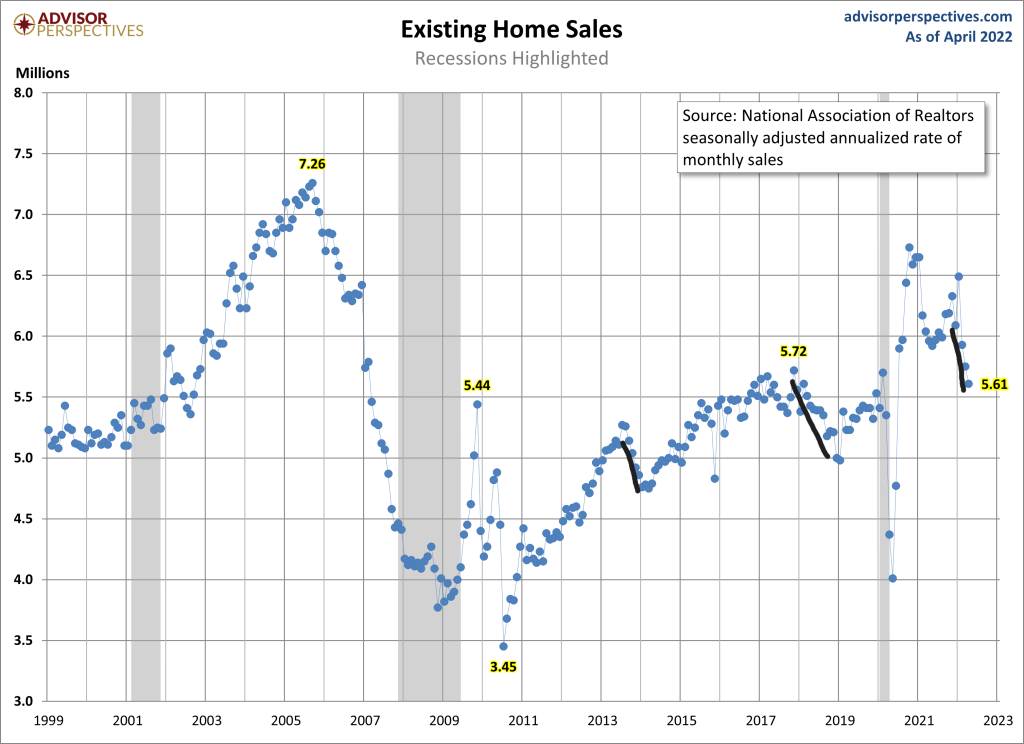
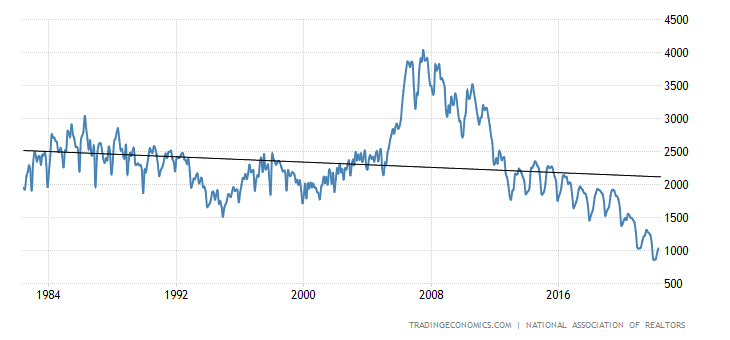
HousingWire: Circling back to inventory, what is inventory data reflecting and how important is it to homebuyers?
Logan Mohtashami: On a good note, inventory is rising this year, and we should be getting more inventory this year and next year. The weekly data is showing more inventory growth, so the NAR data will need time to catch up.
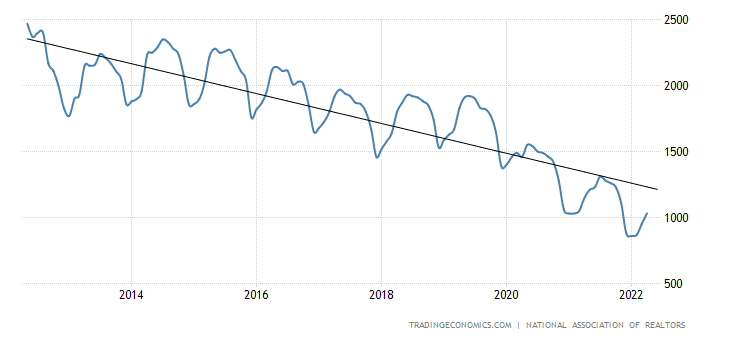
On a sour note, we still need more inventory to return to normal. Once we hit 1.52-1.93 million things can get back to normal.
HW+ Member: Question on this viral TikTok! I had a friend send this to me for input, and immediately knew it’s a great question for you! She makes a three-minute case — which has gotten a lot of views — on investors taking all the inventory! I know this is a topic you talk about a lot. What is your response to this?
Logan Mohtashami: The investor narrative has been blown out of proportion because they’re not the biggest buyers of homes in America.
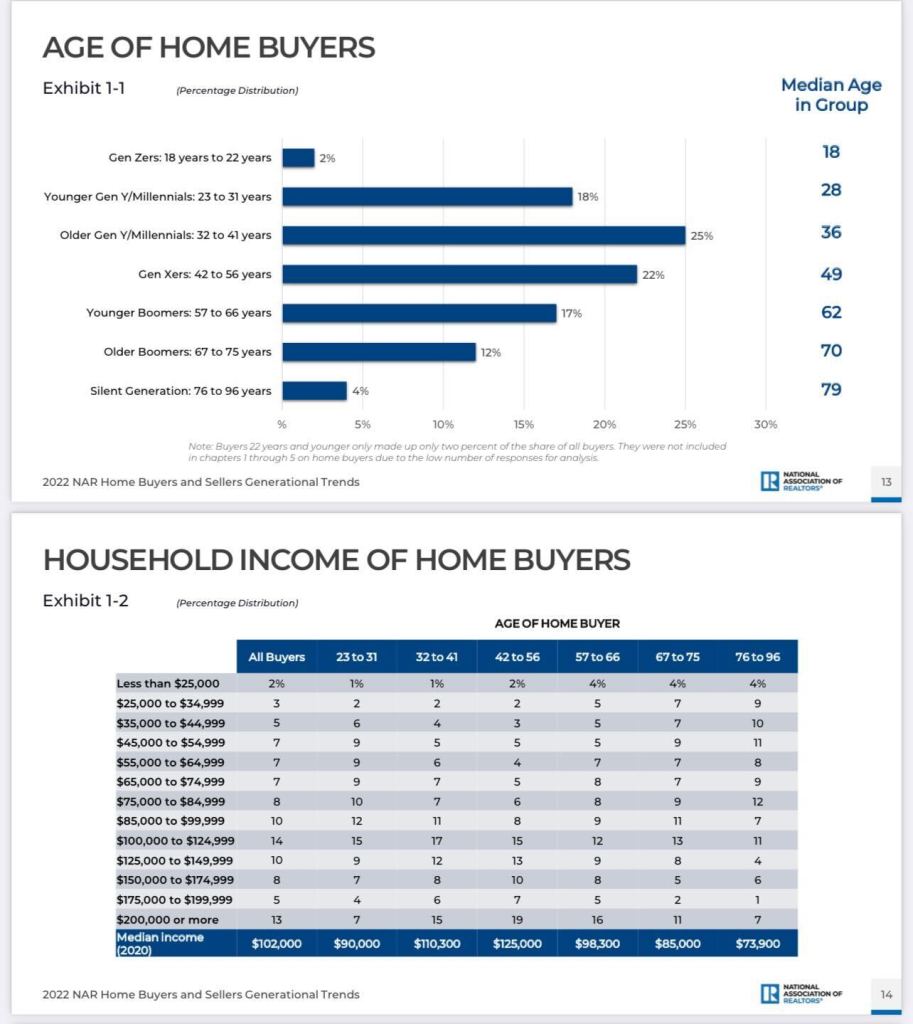
It’s an effective trolling media tactic done by everyone, but if you don’t hate on the Millennials for driving down inventory, you’re doing it wrong since they’re the biggest buyers. Last year we had roughly 6.7 million total home sales, so the 500K of home sales to investors — which most are mom and pop investors — sounds fishy to me.
Also, inventory is rising, so maybe some people should spend more time pricing their homes right instead of blaming investors. I say this because if investors were so big, then housing demand should never fade, but it is fading.
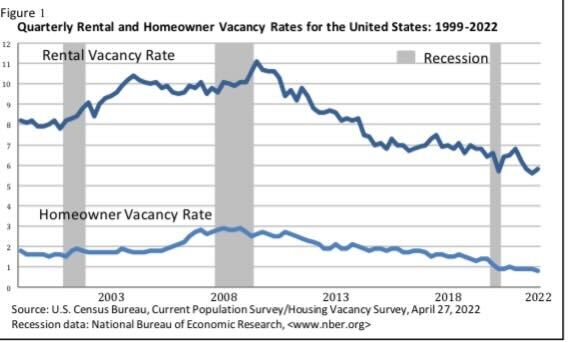
The investor narrative to me was always, in theory, trying to make housing seem like it can’t ever go down. When rates rise, demand fades, inventory goes up when we see demand weakness. Also, renters are human beings too, and rental units on sale are low, so it’s not like these homes are being bought and nobody is living on them.
If she were being honest, she would say we have tons of second homes and vacation homes not being used for renting or home buying; that at least is a valid premise. The reality is that the supply on both ends was dropping for years.
Come 2020-2024, guess who came to the shelter game? The biggest homebuyers in America.
HousingWire: What else would you like to add before we wrap?
Logan Mohtashami: The critical point: housing demand is getting weaker, and rates are now over 6%, which means it can get more vulnerable than the trend we have seen lately. Don’t make it complicated: higher rates with the home price growth we have seen since 2020 is the biggest affordability hit of our lifetime.
This is why my model kept talking about how we would be fine if home prices only grew by 23% for five years; that didn’t happen. While we have these higher rates, home prices are rising yearly because total inventory is still too low. Now you can understand my theme that this is a savagely unhealthy housing market and why I believe once the 10-year yield broke over 1.94%, the housing market changes.
Take full advantage of your HW+ membership and join our exclusive Circle platform dedicated only to HW+ Members! To join the community, go here.


You’ve lost me with this Logan Mohtashami. He touted for so long that there wouldn’t be a recession and then the market wasn’t going to be all that bad and the news “had it wrong”, etc., etc. Not worth reading or listening to.
Technically speaking, we aren’t in a recession yet; no time in history that sales, production, and employment rise during a recession, hence the six flag recession model, which has been back-tested in decades. Five of the six recession red flags are up. Only one left to go; that would go with the historical data going back to the late 1960s
https://www.housingwire.com/articles/housing-starts-data-raises-5th-recession-red-flag/