


Some Americans believed we entered a recession at the start of 2022; however, the jobs report for May came in at 390,000, dashing any hopes that this was the case and starting their weekend on a foul note. We did have some minor negative revisions to the prior reports, but the 10-year yield stayed firm after the announcement at 2.95%, with no real movement.
We have quieted the recession talk, for now, and I am getting more excited about the labor call I made, which predicted that all the jobs that were lost to COVID-19 would be back by September of 2022. With a few months left, let’s take a look at the state of the U.S. economy.
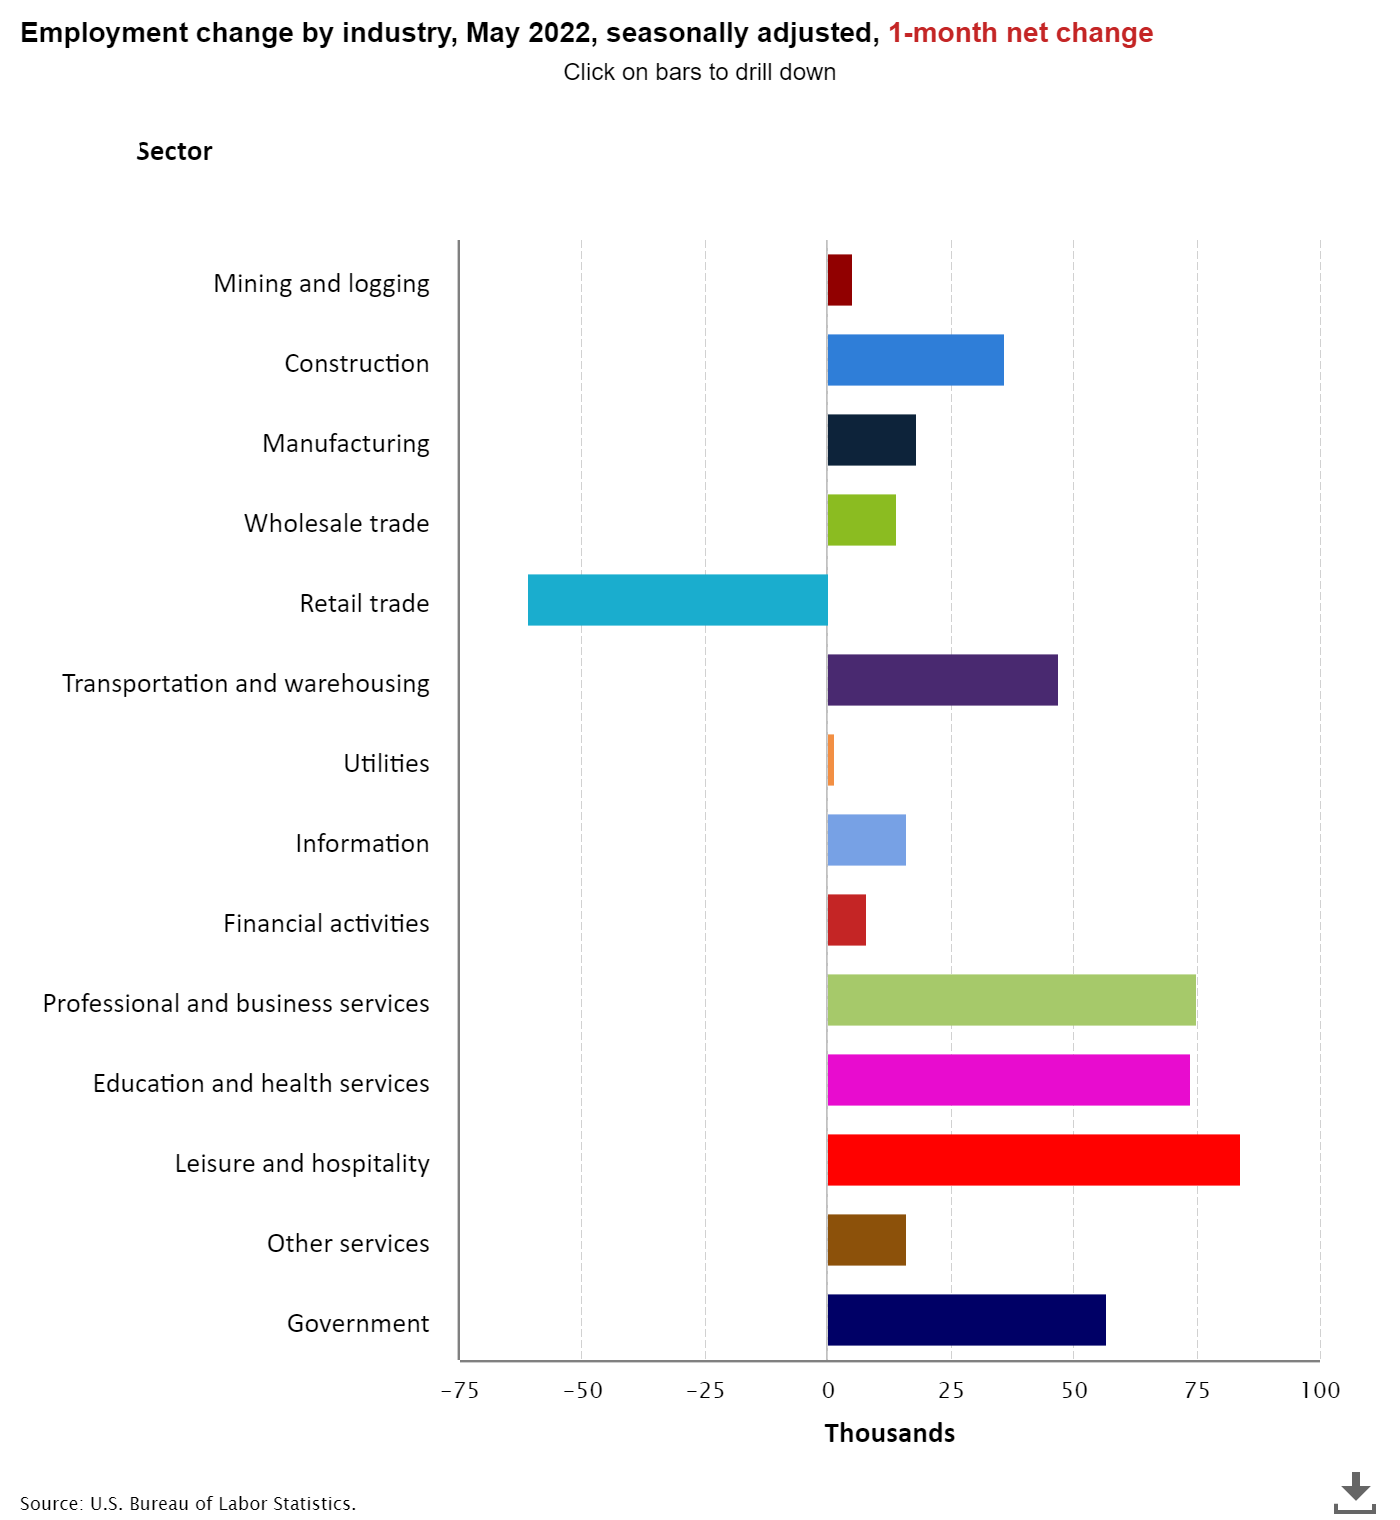
From BLS: Total nonfarm payroll employment rose by 390,000 in May, and the unemployment rate remained at 3.6 percent, the U.S. Bureau of Labor Statistics reported today. Notable job gains occurred in leisure and hospitality, in professional and business services, and in transportation and warehousing. Employment in retail trade declined.
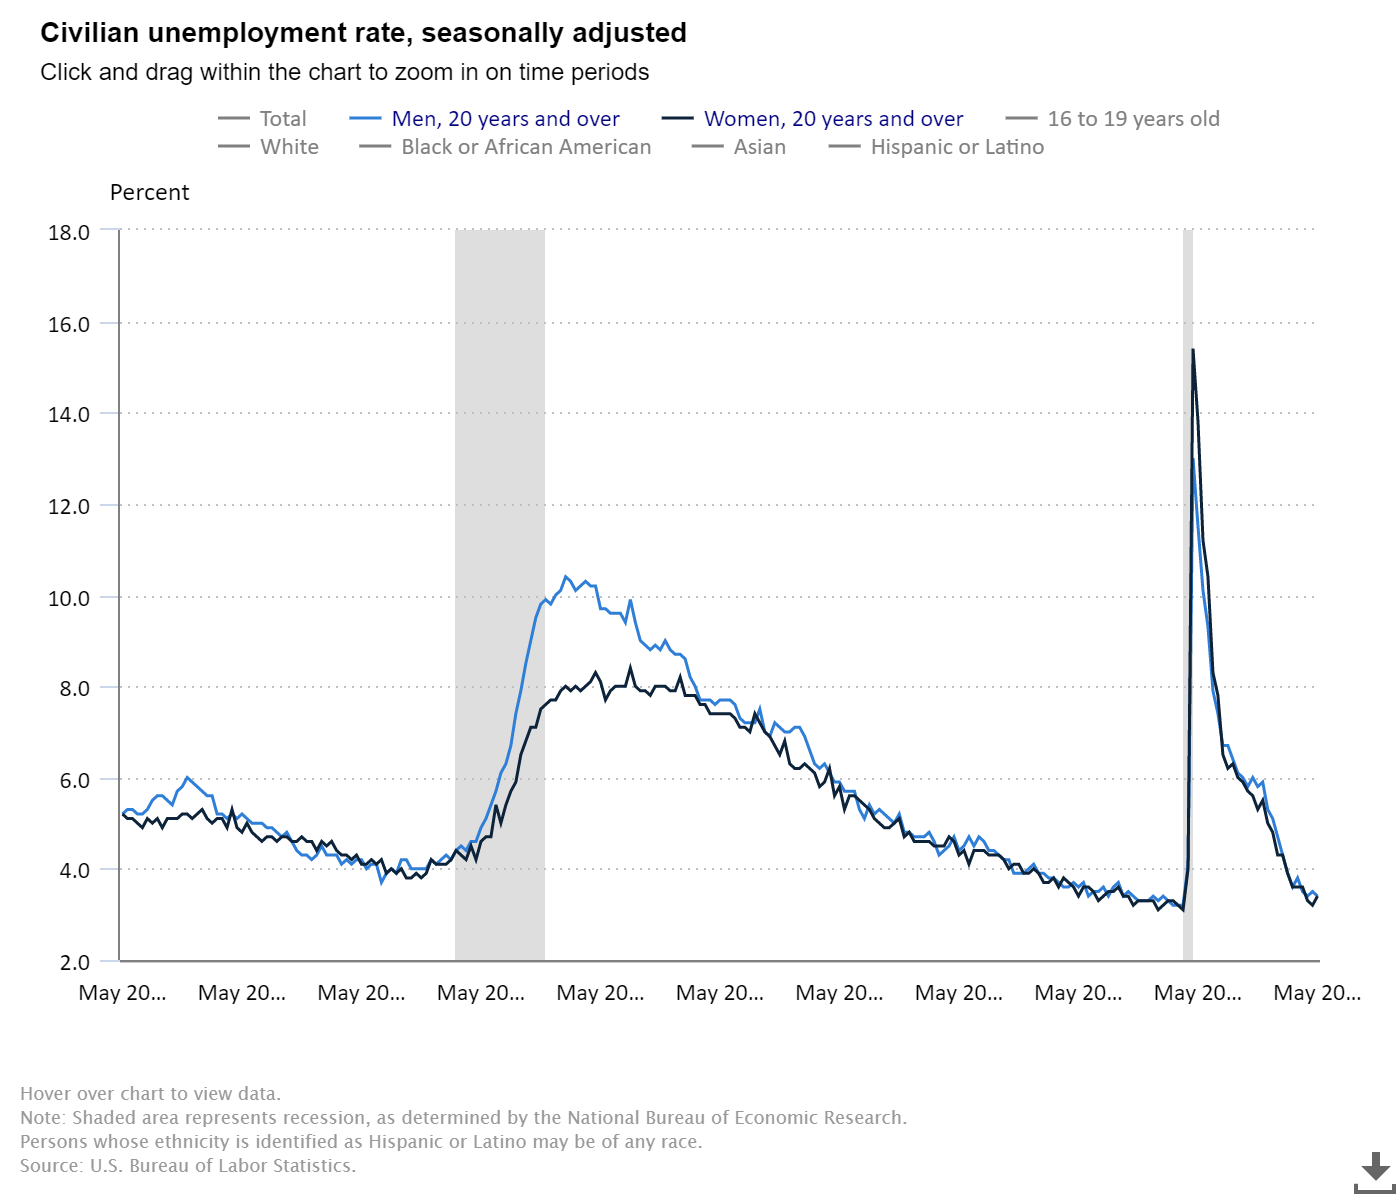
Unemployment rates:
The unemployment rate for men and women ages 20 and over is 3.4%.
A tighter labor market is a good thing, I always say; this means people with less educational backgrounds can get employed as we do have many jobs that don’t require a college education.
Here is a breakdown of the unemployment rate and educational attainment for those 25 years and older:
—Less than a high school diploma: 5.2%.
—High school graduate and no college: 3.8%
—Some college or associate degrees: 3.4%
—Bachelor’s degree and higher: 2.0%
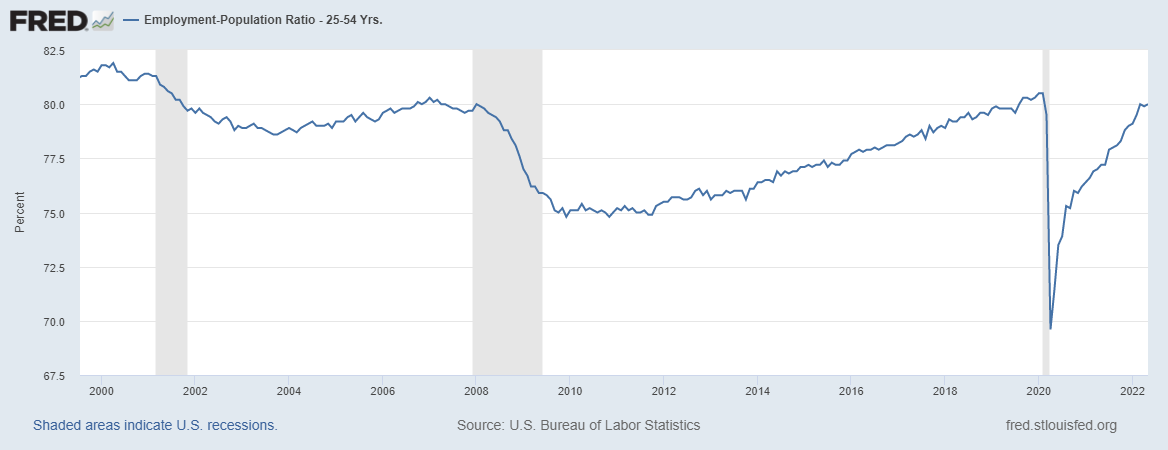
During a job recovery, the data line I love to track is the employment-to-population data for the prime-age workforce, ages 25-54. That’s the proper working-age workforce. The employment-to-population percentage is now only 0.5% away from the pre-COVID peak of 80.5%, currently at 80%.
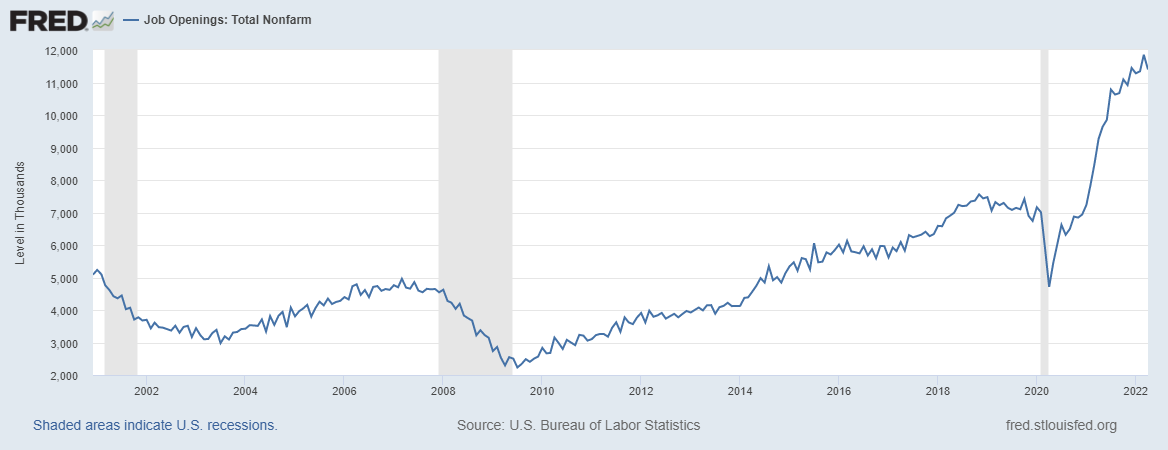
As the COVID-19 recovery got stronger, the internal labor market dynamics have been very positive for a while now, as we had a lot of job openings that needed to be filled. In fact, over a year ago, when we had a jobs report that missed estimates, I stressed early in this recovery that job openings would get to 10 million, which nobody, not even the people who work at the BLS, thought was possible.
Today, job openings are at 11.4 million and the highest print we have had in this recovery so far has been 11.9 million.
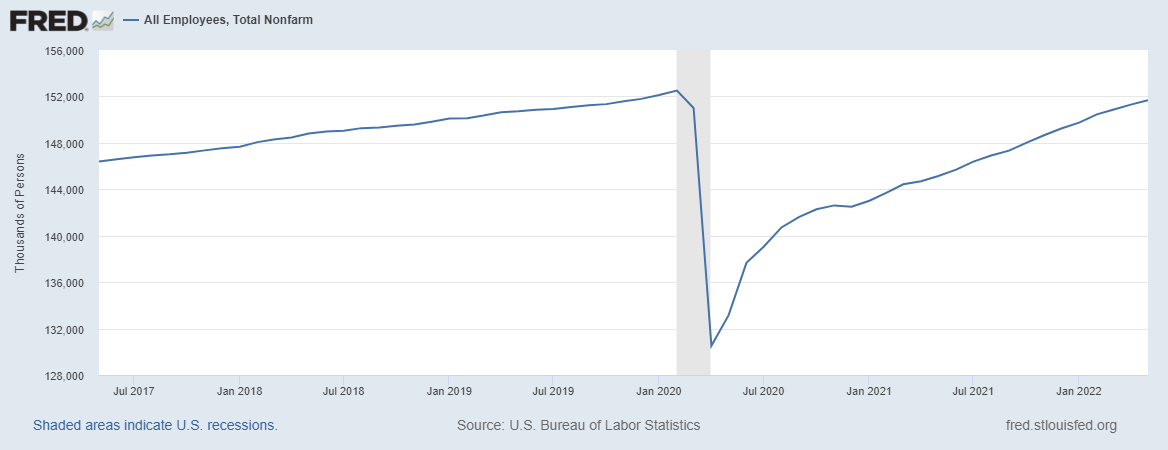
Total jobs data
Even though I retired my America is Back Recovery model on Dec. 9, 2020, I knew getting all the jobs back lost to COVID-19 would take some time. Even though the recovery was the fastest ever, getting all the labor back from a global pandemic and having an aging society wasn’t as fast as some had hoped. However, I was confident we should get it all job back by September of 2022.
—Feb 2020: 152,553,000 jobs
—June 3, 2022: 151,682,000 jobs
That leaves us with 817,000 jobs left to make up over the next five months, which means we need to average adding 217,750 jobs per month. And the unemployment rate currently stands at 3.6%.
Look at the jobs data and which sector added jobs in March: Construction jobs came in positively, but retail trade took a big hit. Coming from the demand boom in COVID-19, specific sectors of our economy have too many people working for them as that demand boom can’t be sustained. I use Peloton as my example for this, so you can see layoffs or hiring freezes with those companies while the general economy is still in an expansion.
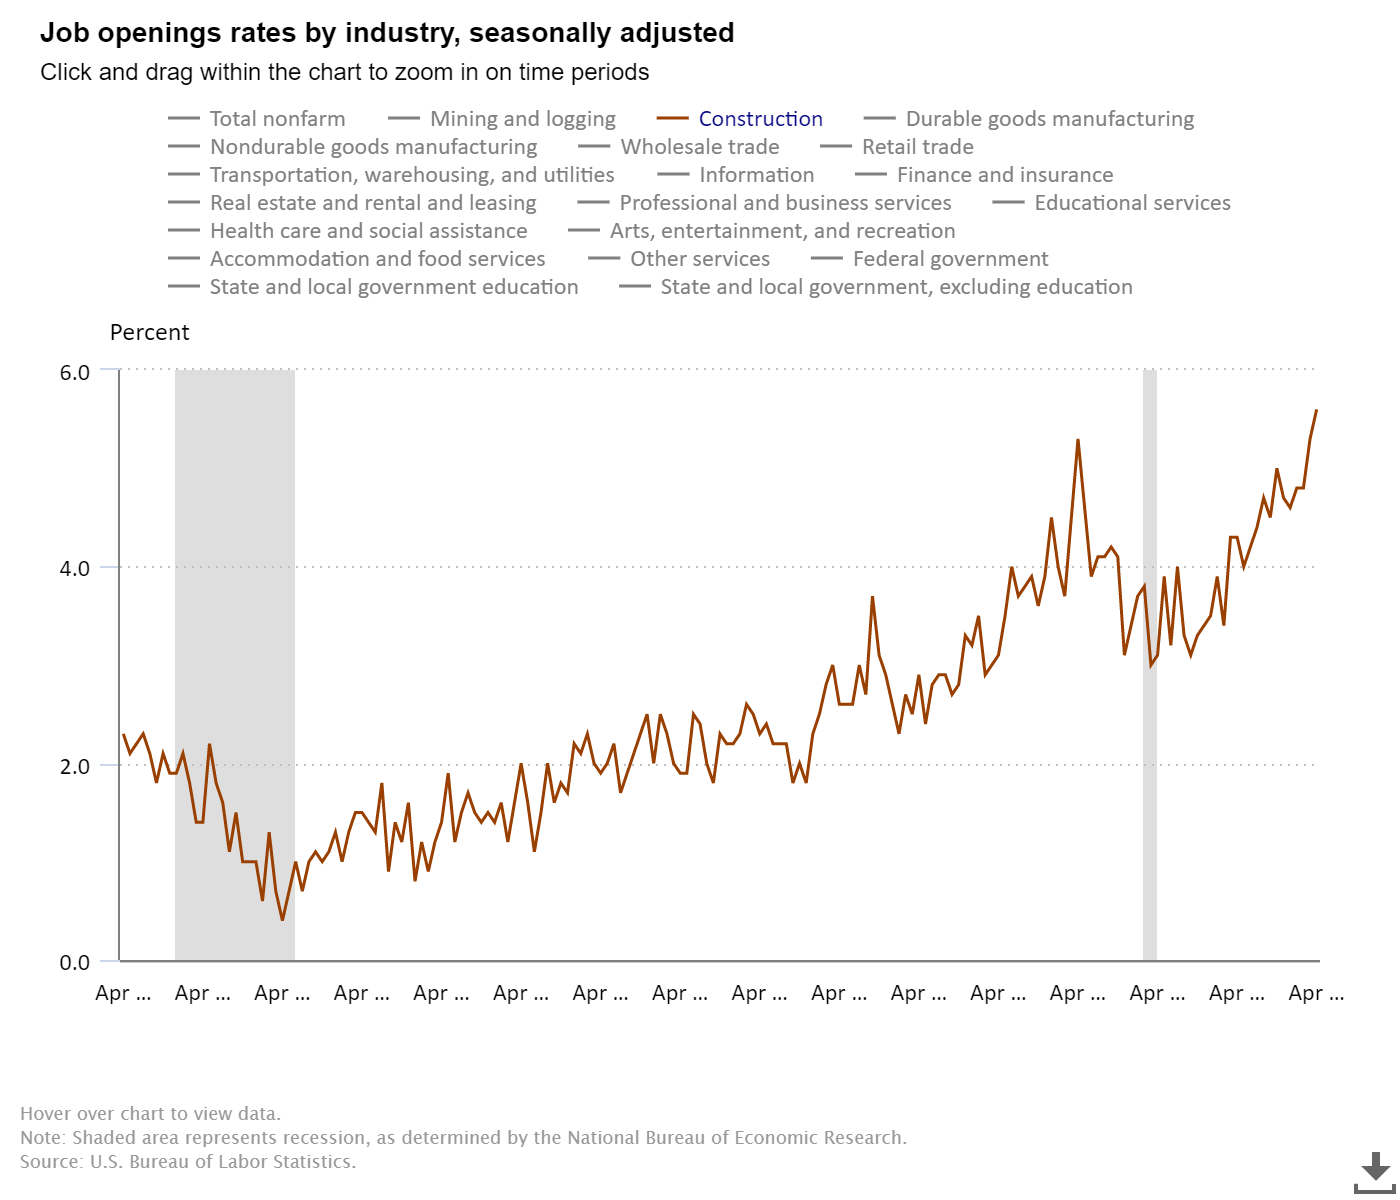
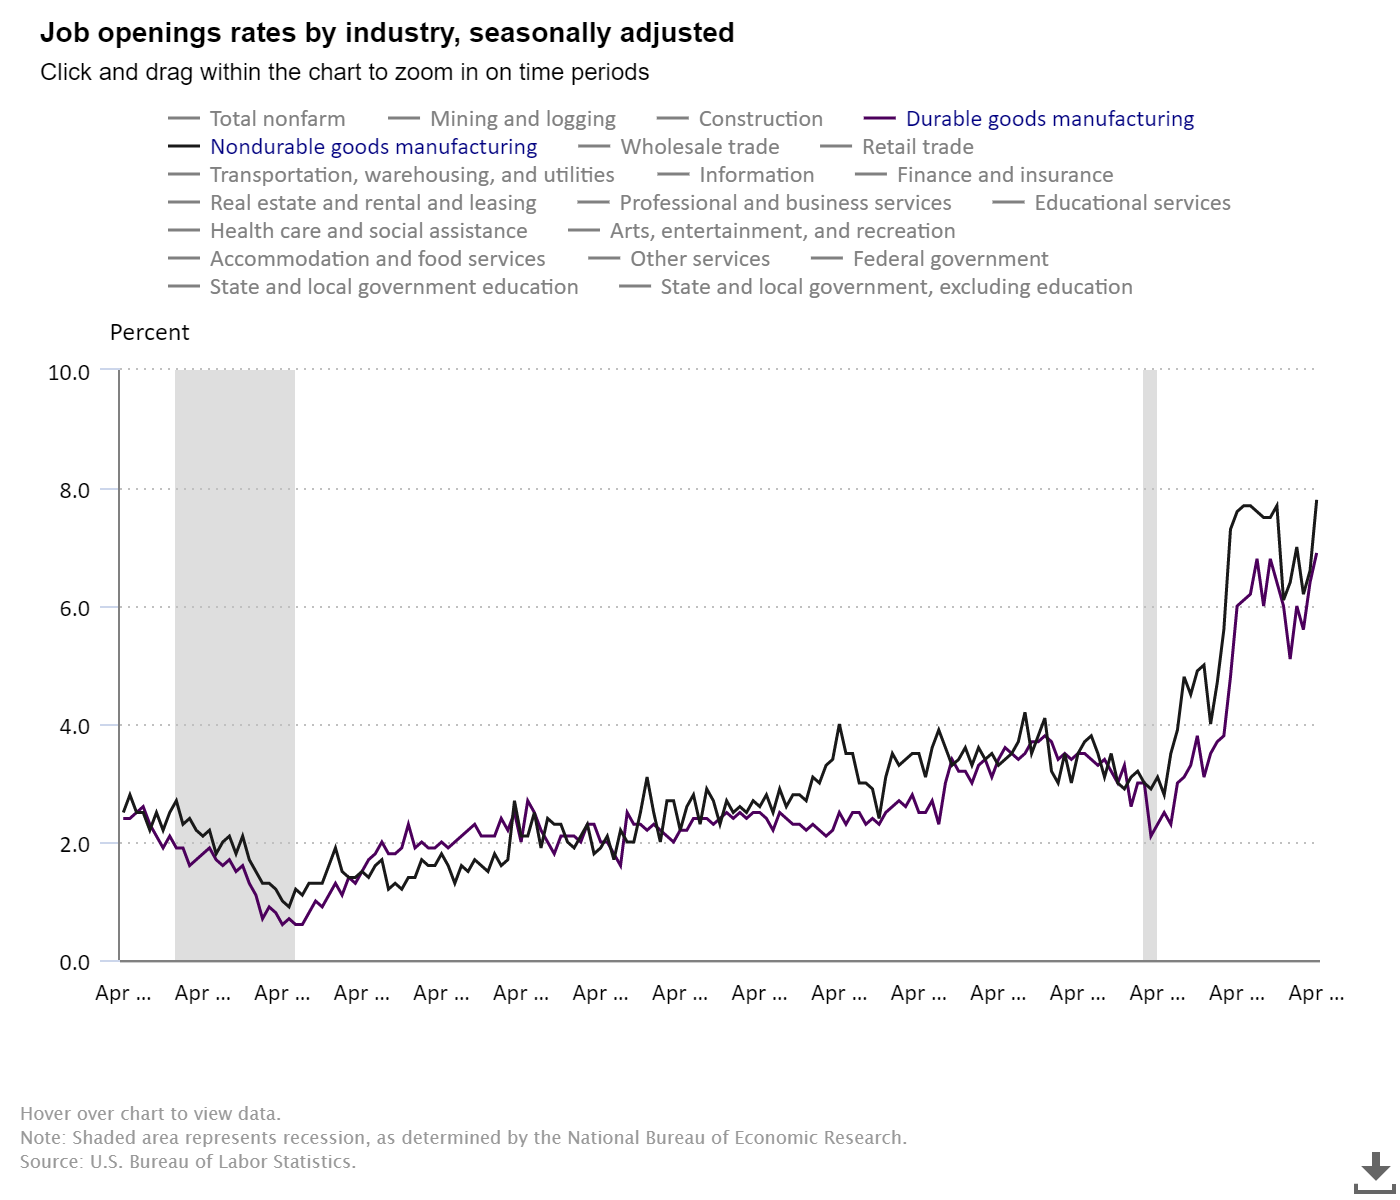
Job openings in construction and manufacturing have picked up recently. The notion that robots and immigrants took all the jobs hasn’t aged well over the decades.
Recession red flag watch:
Where are we in the economic cycle? Only four of my six recession red flags are up, so until they are all up, I don’t use the word recession unless I can point to an extreme economic shock, such as COVID-19.
Let’s review them in order, as my model is based on an economic progression model, which isn’t the most exciting way to look at economics. However, economics done right should be boring. Here are the recession red flags:
1. The unemployment rate got to 4%; this is a progression red flag, meaning the economic expansion is more mature.
2. The Federal Reserve starts to raise rates, another progression red flag; expansion is more mature.
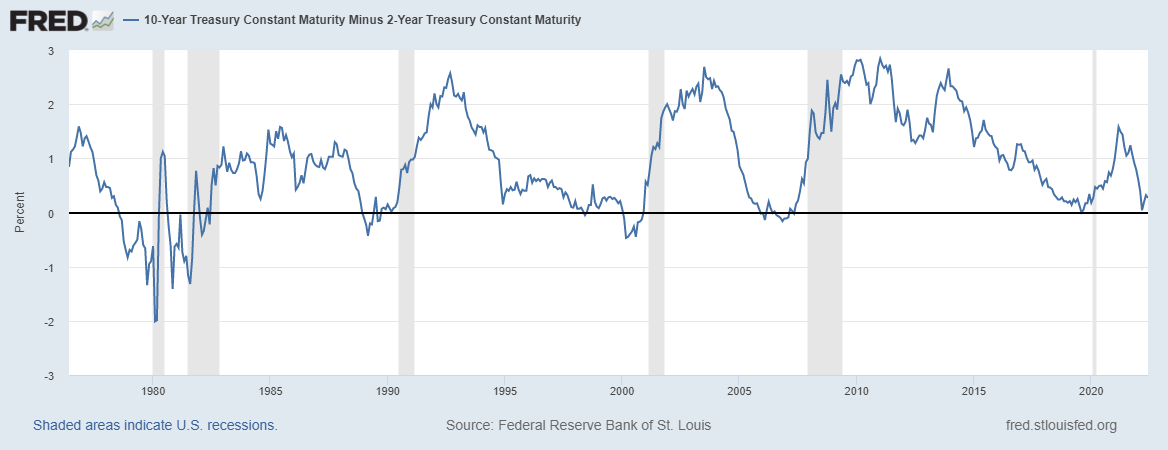
3. The inverted yield curve. This is more of a market drive bond yield red flag; I had been on an inverted yield curve watch since Thanksgiving of 2021. This is when the 2-year yield and 10-year yield slap high fives and say hi to each other: another progression red flag, the more mature stage of the economy.
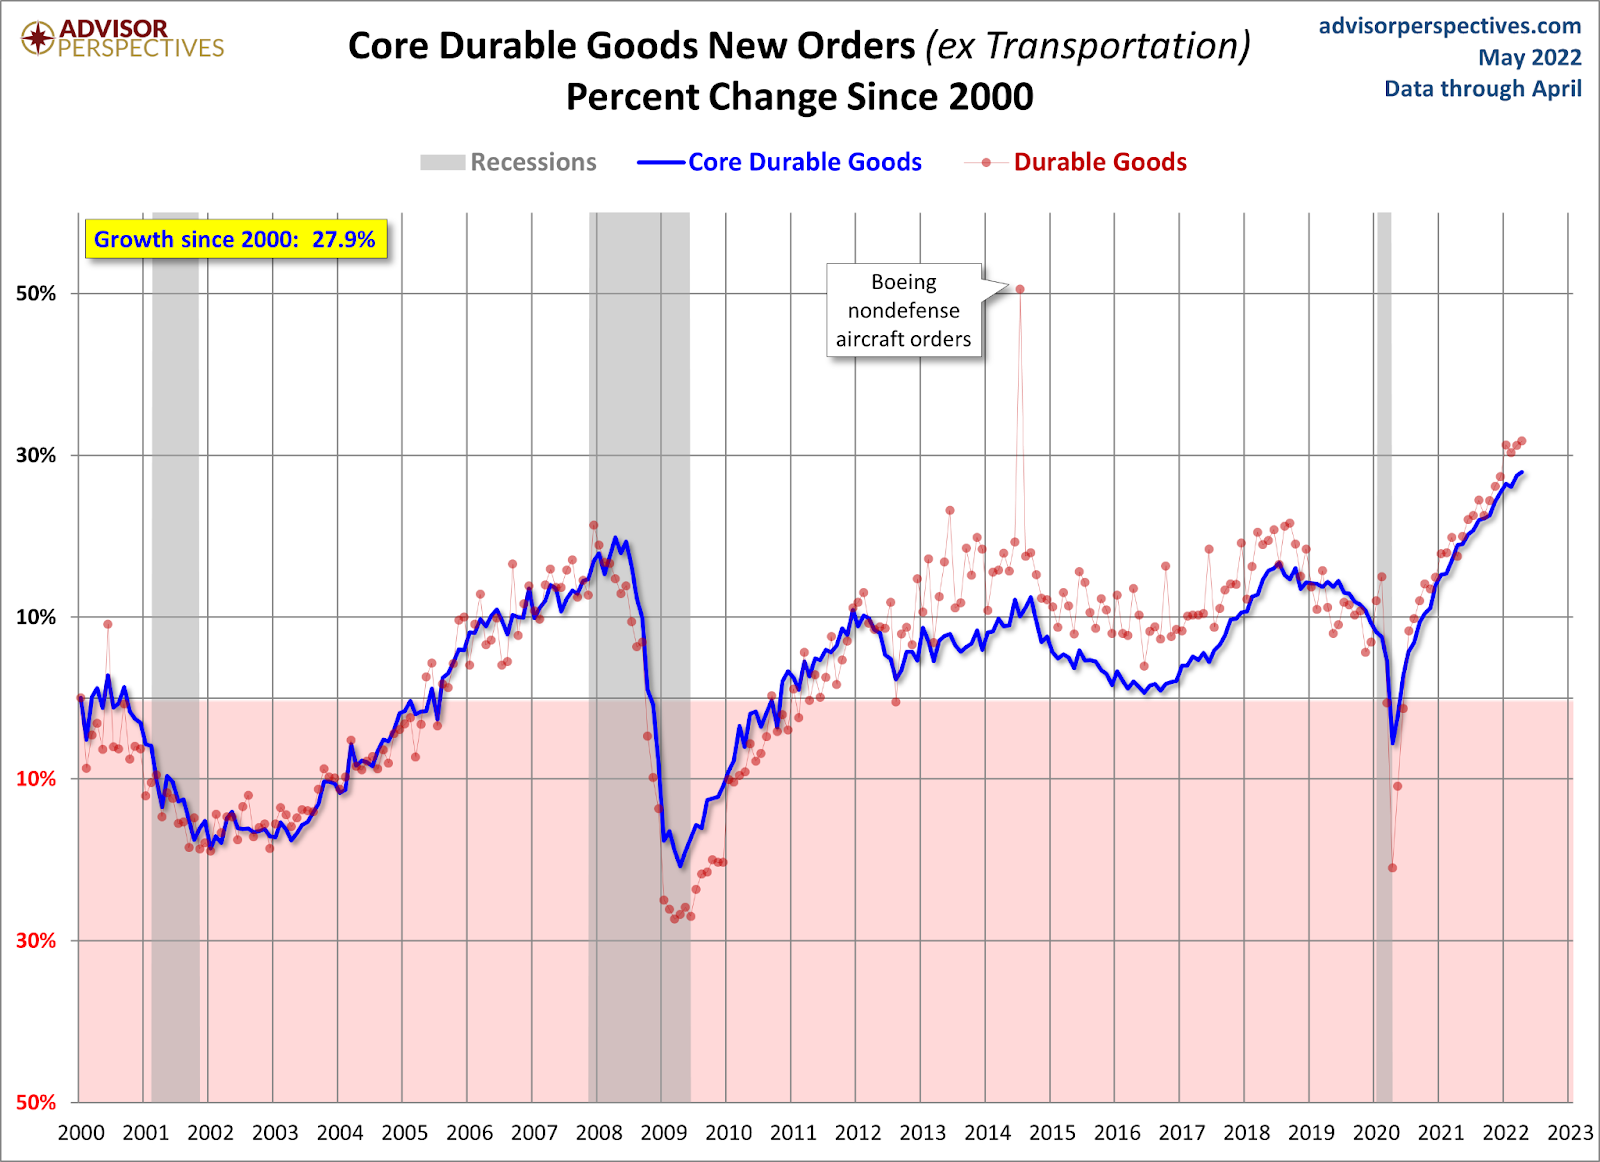
4. Find the overheating economic sector where demand can’t be sustained. Once that demand comes back to normal, people will be laid off. We see this in the durable goods data. A few companies are laying people off or putting a hiring freeze
Now the last two recession red flags are the most important ones. So far, they’re on my radar for the next 12 months, but I haven’t raised them yet.
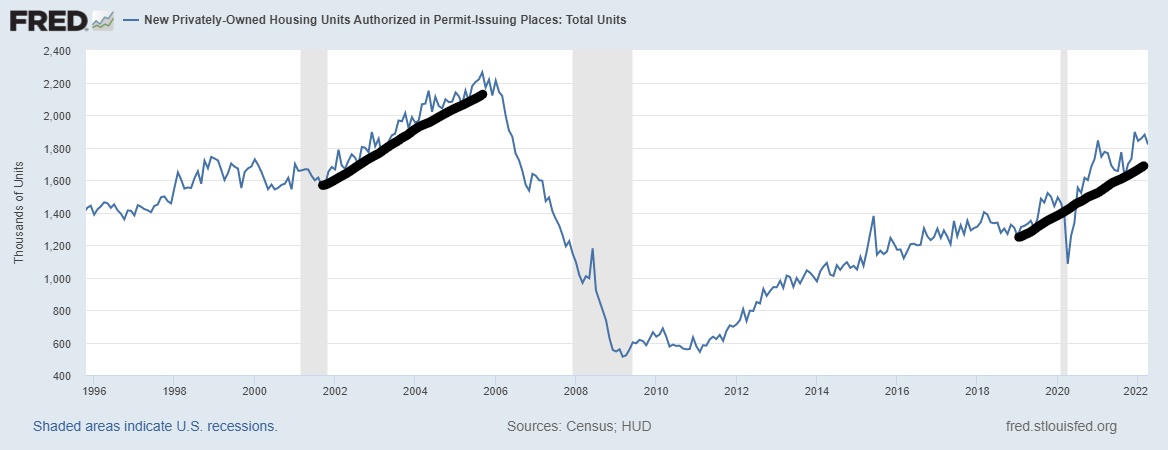
5. New home sales, housing starts, and permits fall into a recession Once mortgage rates rise, the new home sales sector does get hit harder than the existing home sales market. Recently we have seen a big supply spike in the new home sale data which indicates a big decline in new homes. However, this spike in supply isn’t like the spike we saw during the housing bubble crash, it needs more context.
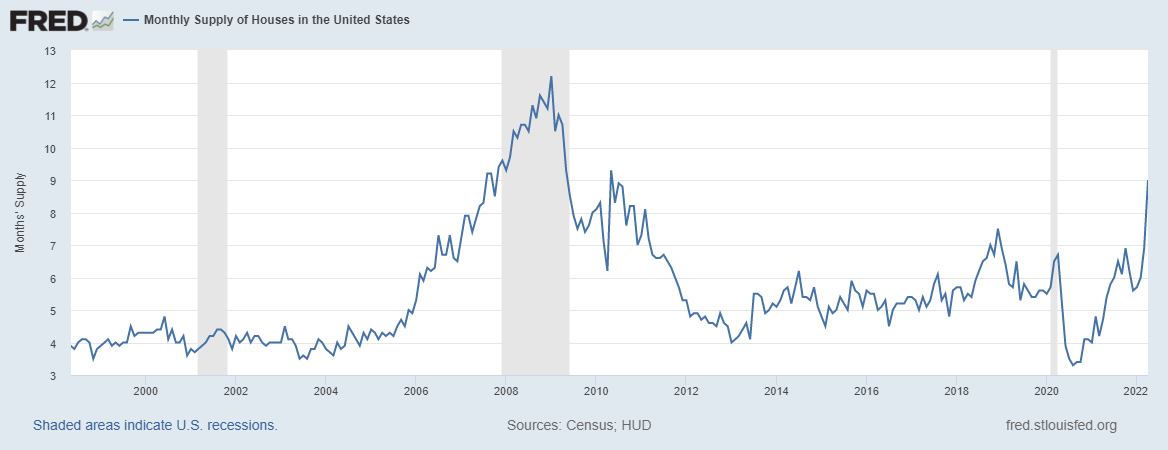
Out of that nine months of supply for new homes:
- 6.0 of that are homes that haven’t started to build yet. Ghost Supply
- 2.2 Months are homes under construction
- 0.8 months are completed new homes
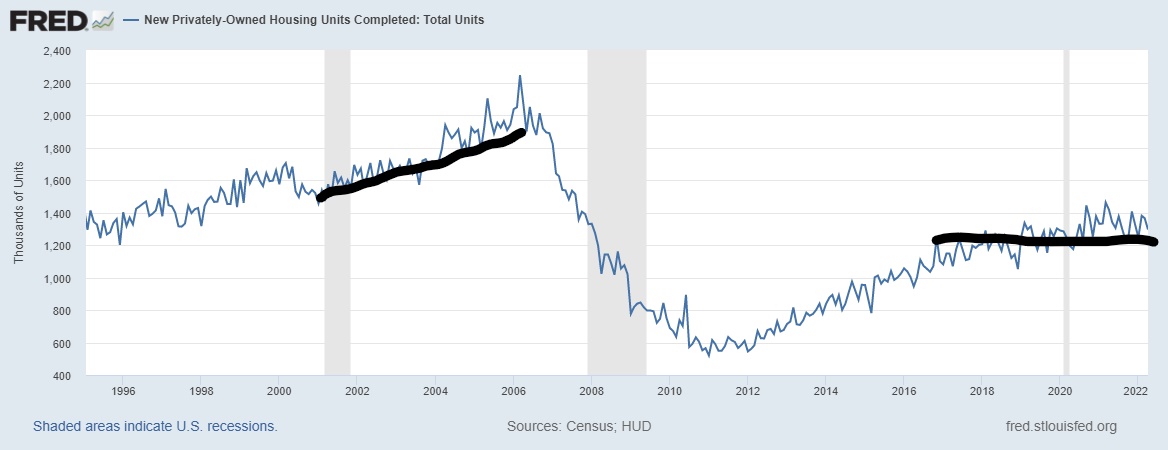
Remember that the housing completion data in America looks terrible, so the builders need to sort out how many of the homes in contract that they haven’t started on yet can be sold.
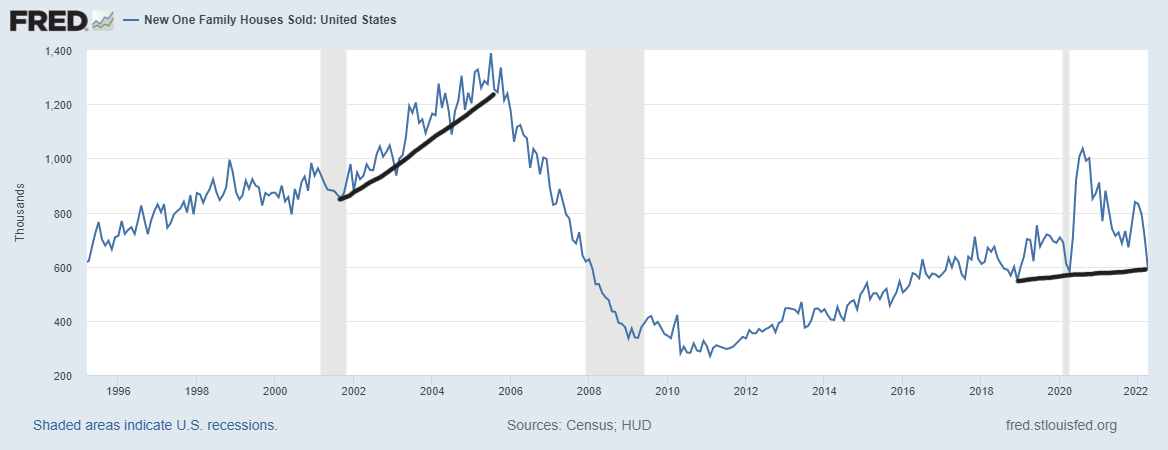
New home sales are getting weaker; the final print is back to 1996 levels. However, starts and permits are holding up. Once they start to fade, I can raise this red flag. We haven’t had the FOMO housing market of 2002-2005 again; I believe that adorable marketing line isn’t warranted.
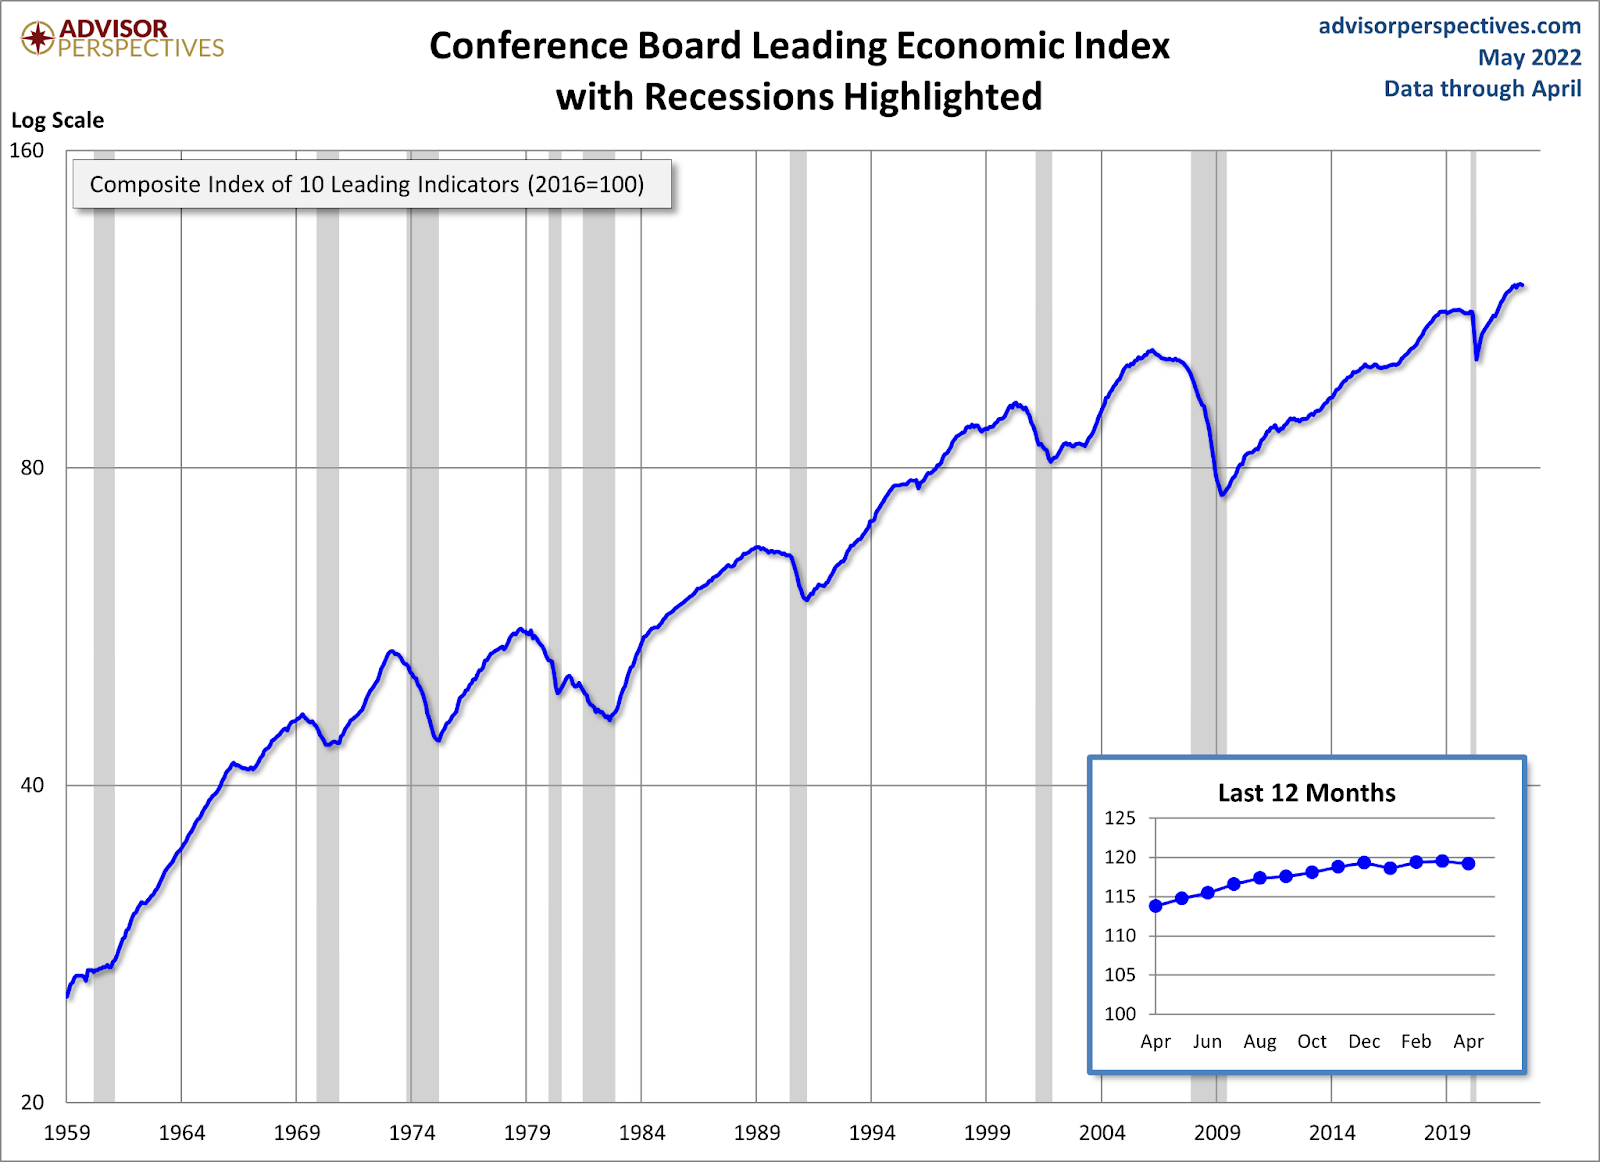
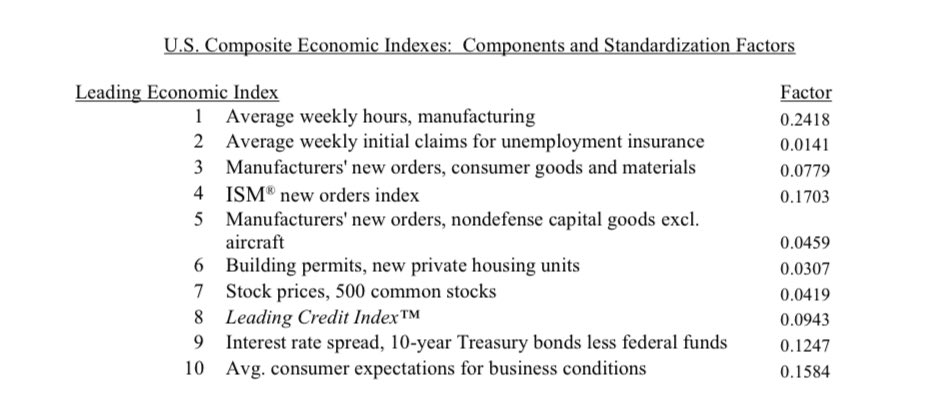
6. Leading economic index declines 4-6 months before a recession. We have data lines here for this index; historically, it fades into every recession outside a one-time huge economic shock like COVID-19. So far, it’s not showing much growth but it’s not declining either.
Here are the components for you nerdy types like me.
As the economic cycles mature, we always need to look at the economy differently. I believe progression economic models are more valuable than getting on a Twitter or YouTube page screaming the world is ending for clicks. The Russian Invasion and the China lockdowns have added new variables into 2022 that weren’t part of my forecast.
However, since 2020, we are all used to events happening that we didn’t expect. Regardless of them or anything in the future, I focus on the data and the new variables that can change that data. Regarding mortgage rates, as long as the economy is holding firm and inflation is high, bond yields won’t make an aggressive move lower, but it does look like it has peaked short term. The rate of growth of the economy is slowing, and so are some of the inflationary data lines outside energy and food prices.

