


When you hear people say that the current housing market is like 2008 all over again, you may want to remind them of the huge differences between this market and that one.
The previous economic expansion, from 2010-2019, wasn’t a housing bubble. Quite the opposite: In that cycle we had the weakest housing recovery ever, even with the lowest mortgage rates during the longest economic expansion ever. When you don’t have a boom in housing market demand, it’s hard to have an epic bust.
Regarding the current housing market, I am on record expressing my concern about prices overheating. Because of this I am calling this the unhealthiest housing market post-2010. But is it a bubble? Bubbles don’t typically occur in the same sector in back-to-back cycles, so although prices are hot, I believe the price increases don’t warrant the housing bubble label due to the lack of bubble-driven sales growth.
There are several important reasons why the market today is materially different than the bubble-forming market of 2005.
Speculation demand
First, a bubble needs speculation demand and this generally coincides with excess leverage. From 2002 to 2005 we experienced a credit boom due to the rapid increase in borrowing for speculation purchases. We were able to ramp up demand and feed the credit boom by offering higher risk, exotic loans. Pretty much anyone could get one of those loans.
With a bubble, buying deviates from the trend and this tends to be short-lived. The housing credit boom took off in 2002 and lasted until 2005. Existing home sales, new home sales, and real home prices all took off during that time.
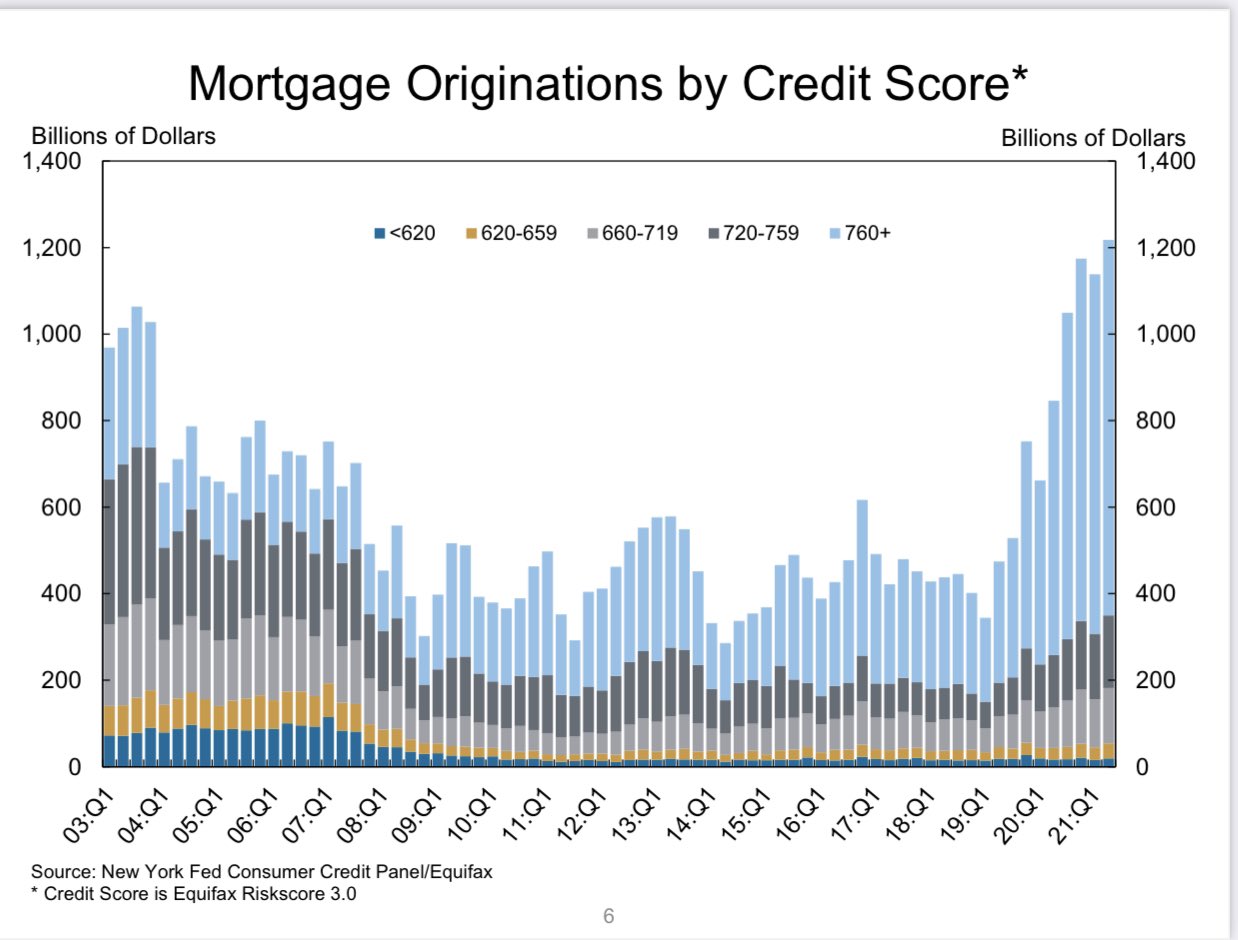
Today, we have healthy replacement buyer demand, but very little speculation demand. Demand is not based on speculation buying like it was in the mid-2000s. We have the demographics to replace buyers that are leaving the market because they already purchased a home or for other reasons. We know this isn’t a bubble because although we have healthy demand, we are not experiencing a dramatic increase in mortgage originations. Purchasers today need to qualify for low-risk loans that require adequate cash flow.
There is a huge difference between the average exotic loan holder of 2008 and our current mortgage holders.
The housing market we have had from 2014 to 2021 doesn’t come close to any overheating credit boom or sales boom type of market. In fact, if we were able to capture all the home sales that we should have had last year, but were delayed due to the COVID-19 shutdowns, home sales would have been flat to negative this year.
In 2021, every single existing home sales print has been higher than the total existing sales for 2020. This is because mother demographics is providing replacement buyers and keeping demand stable but not booming.
Tight credit crashes demand
It is true that when we are entering a recession, credit gets tighter because banks are less inclined to take higher risk loans. This happened in March of 2020, when we experienced a short-term mortgage market meltdown at the start of the COVID crisis. In general though, we have had liberal lending standards for decades in a marketplace with highly subsidized housing.
During the credit bubble years from 2002 to 2005, we had both debt expansion and growing sales. In 2006 to 2010, credit for exotic loans that were popular from 2002 to 2005 got very tight. The tightening credit caused a slowdown in demand for sales.
The lack of financial background is a common denominator of those who have been saying that lending is getting tight. The housing bears hope that credit gets tight and smashes demand. But that is not happening. Lending today is boring — as it should be. Boring is sexy for housing economics.
Homebuyers today have a positive cash flow with longer-term, fixed debt mortgages. Because the higher-risk ARM loans and other exotic products were not offered from 2014 to 2021, credit does not need to constrict to keep the market safe. Lenders could raise the downpayment levels on conventional 30-year fixed loans as a means to balance risk, but homebuyers today have high cash flow so these measures have not been needed. The era of low FICO score Americans owning homes in scale is over and those times are never coming back.
Today, housing demand is healthy and stable and credit is available for those who can afford to own the debt.
No recession!
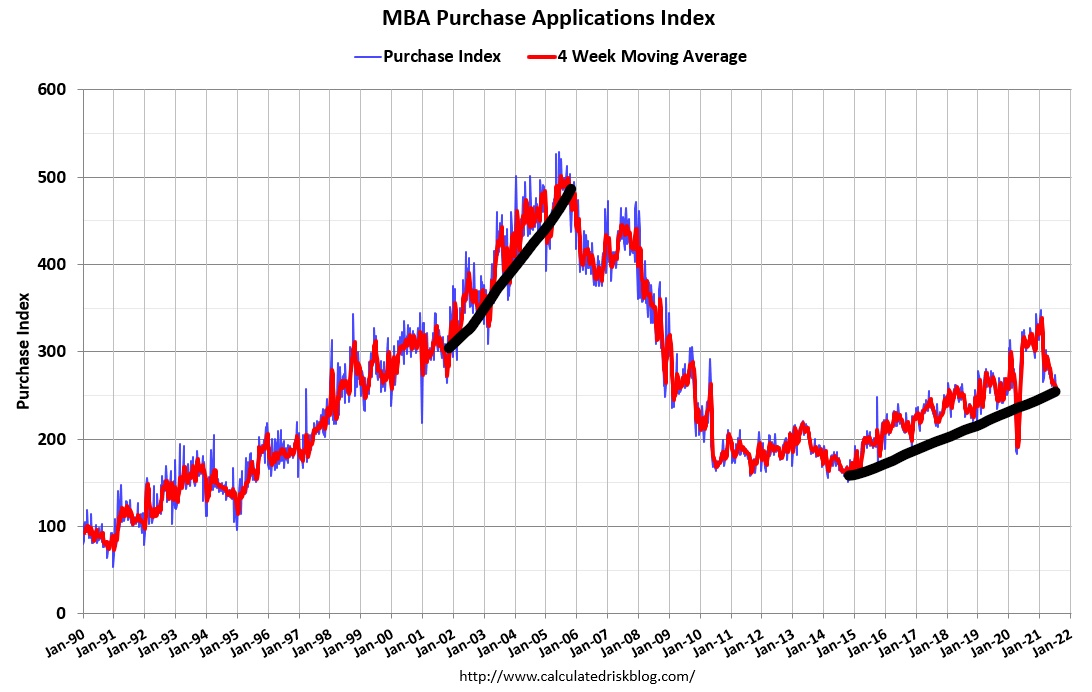
In 2005, housing demand peaked. Purchase applications, existing home sales, new home sales, and housing starts began falling in 2005 and bottomed out in 2008 because the peak levels we had in 2005 were not sustainable. In 2008, as the great recession started, credit got tight and large scale job losses occurred. All the recent homebuyers had not yet built equity.
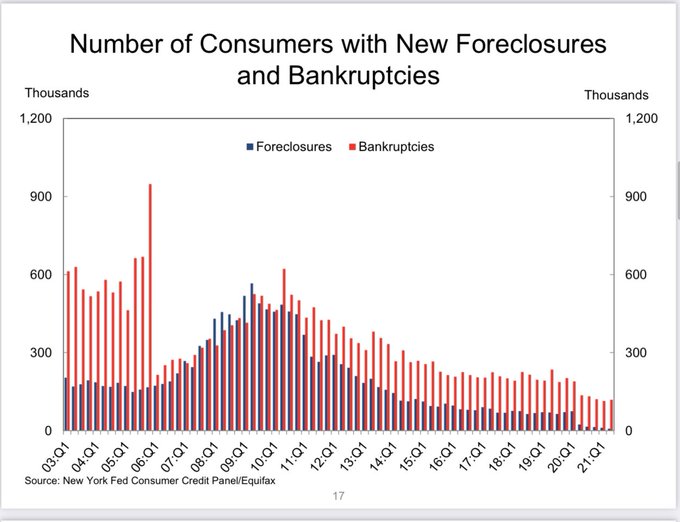
Added to this, the cash-out refinance boom meant many long-time homeowners also had little to no equity once home prices began to fall. None of that is happening now: no recession, no large number of low equity loan holders, no falling home prices! This is why I went after the housing bubble boys and the forbearance crash bros so hard in 2020 and 2021.
The COVID-19 recession ended in April of 2020. In my articles for HousingWire, I told my readers which data lines to follow to determine when the economy, and the housing market in particular, were going into recovery.
We are now in year one of the economic expansion. Jobs are being created each month and all the jobs lost to COVID-19 should be back by September of 2022 or earlier. Even with the Delta virus infecting Americans at a higher clip each day, Americans seem to be taking this new challenge in stride, unlike the chaos we experienced back in March and April of 2020.
We have adapted and learned to consume goods and services with an active virus among us. We have 9.2 million job openings, most of us are back to work and in time the 7,650,000 jobs that are were lost due to the crisis will be recovered. This is wholly different than 2006-2011 when we had home sales falling, credit getting tighter, home prices falling and inventory on the rise since 2006.
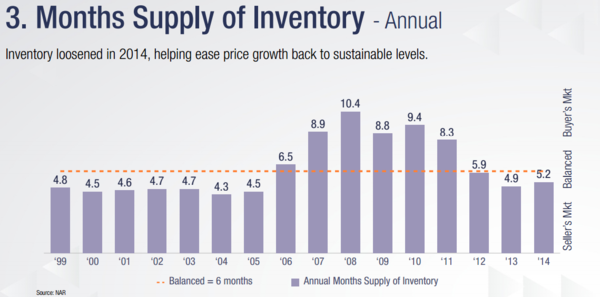
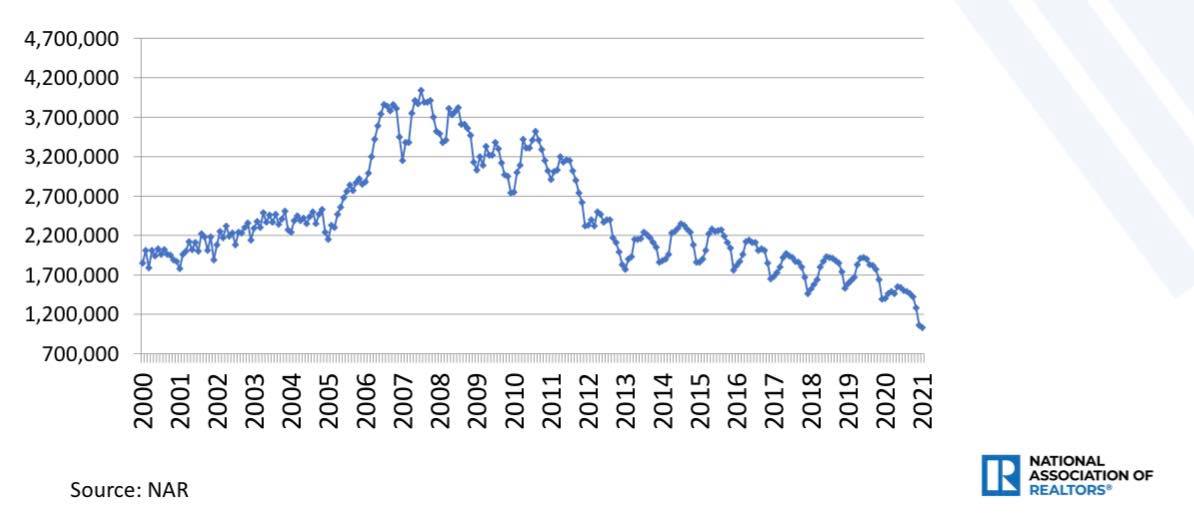
In contrast, today jobs are being created and homeowners’ loan profiles are excellent. Loan holders have fixed low debt costs versus rising wages. And because Americans are staying in their homes longer and longer, inventory has been falling in a stubbornly fashion since 2014.
Even the recent increases in inventory for the existing home sales market is still historically low, which is not a healthy outcome for the housing market.
Forbearance
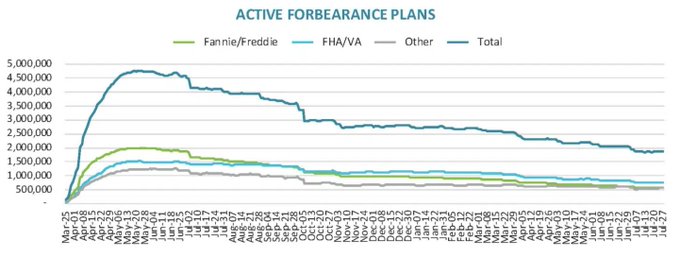
Forbearance has been the bogieman of the housing market since the start of these programs. A lot of people have speculated that there will be a bubble crash in 2021 because forbearance programs will end. But the housing bubble boys have been wrong for a decade. According to them, forbearance programs were supposed to put on hold 10 million to 15 million loans.
When the forbearance programs started, a good chunk of these loans were projected to go into delinquency and straight into some type of forced selling, foreclosure or short sale. But instead of housing collapsing, the forbearance data collapsed. The near 5 million loans that were once in the programs have been whittled down to 1.9 million. There’s a very good shot that forbearance data gets to under 1 million at some point in 2022.
From BlackKnight https://www.blackknightinc.com/blog-posts/forbearances-see-weekly-rise/
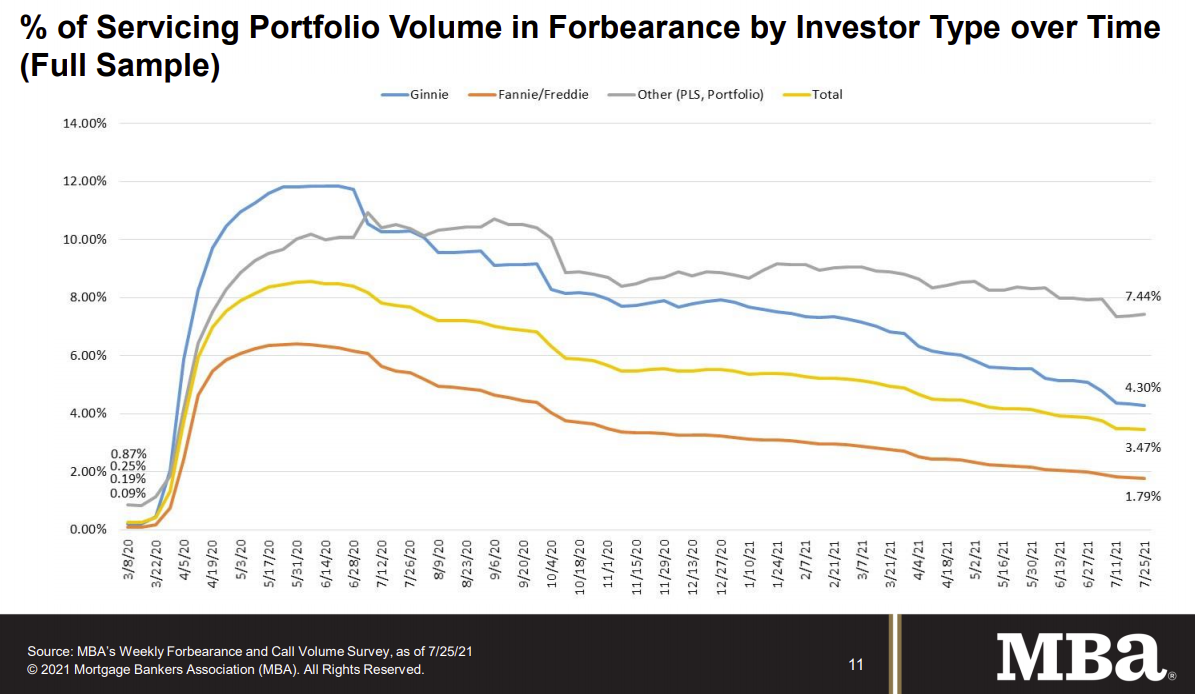
From the MBA: The GSEs’ delinquency ratio is now 1.79%.
In the second year of this economic expansion, we have sub-4% mortgage rates and the best demographics for housing ever. And it’s not just the millennials who are buying. Housing demand is coming from move up, move down, cash and investor buyers along with all those coming into the ages for first-time home buying. That is our set-up for 2022. The notion that prices are going to go back down to 2012 or even 1996 levels is just silly.
In 2005 to 2008, we had forced selling of homes with no equity in a job loss recession, with credit getting tighter and weaker demographics for housing. The period from 2002 to 2011 was essentially the exact opposite of the housing market environment of 2014-2021.
Having said that, why do I now stress how unhealthy the housing market is? In brief, prices are accelerating beyond my comfort zone. If the cumulative growth in prices during the years 2020 to 2024 maxed at 23%, I believed that would be manageable. Nominal home price growth of 4.6%, on average, each year, would mean home price growth would not be much of a concern versus wage growth.
But home price growth has been more than 23% in less than two years. The housing market broke out of its doldrums in February of 2020, before the COVID crisis started. Median home price growth had gone up to 8% that month. In 2019, real home prices briefly were negative year over year, which at the time, I said was healthy. If we could create an ideal environment, home price growth would be flat to negative for the next three years, allowing wages to grow into the expansion. But the real world isn’t ideal and the housing market doesn’t care about my model.
I hope we do get a repeat of the economic conditions we had in 2013 to 2014, which was the last time we saw unhealthy price growth like we are seeing now. After 2013, the rate of price growth fell, which was very healthy. Purchase application data went negative 20% year over year, on trend, and existing home sales ended the year slightly negative compared to 2013.
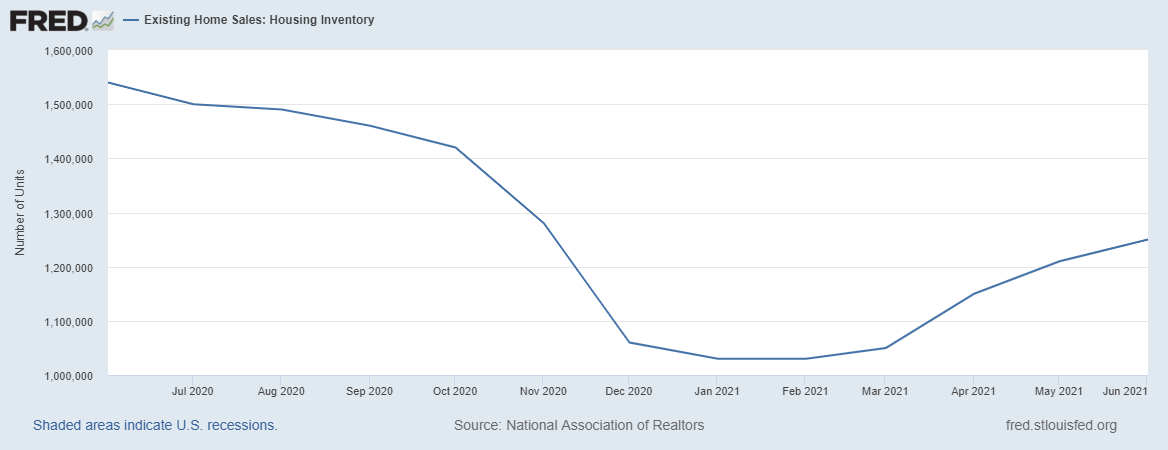
This kind of retraction of price growth after a period of rapid growth also happened in 2018 to 2019 as well, but much less extreme. We need balance to replace overheating. Back in April I said home price growth should cool down. By late June we started seeing some signs of a cooling market with rising inventory. The S&P CoreLogic Case Shiller home price data is still showing growth even while inventory is rising, but that data lags.
Inventory increasing from all-time lows is due to the usual seasonality of this metric. We need to see total inventory levels rising this year and into next year to really buy into the idea that the market is cooling and becoming more healthy.
But the years 2022 and 2023 are the sweet spot years for housing demographics. We will have the largest group of ages 30 to 31 in history, and the average age of the first-time homebuyer is now 33. When we add in all the move up, move down, cash and investor buyers, demand will stay stable. This will be problematic for those of us who are cheering for inventory to grow, but since we don’t have a credit boom, I am hoping that we get that drastic cool-down in prices.


Spot on.
I feel like a broken record repeating the economic fundamentals to the first time buyers saying they will wait for their purchase or move-up / downsizers who are considering selling now and renting for a year or two “so we can buy when prices precipitously drop.” Is there a mechanism for me to bulk purchase copies of this article for sending to my client family?
Many people don’t take the time to look at historical data to show the difference between 2002-2011 vs. 2012-2021. Personally, historically, these two periods are as different as you can imagine when talking about the credit, sales, and demographic profiles. This was the big reason why the Housing Bubble Boys failed so badly from 2012-2019 and took it to another level with their flawed premise of a near 90% crash in home prices back to 2012 levels.