


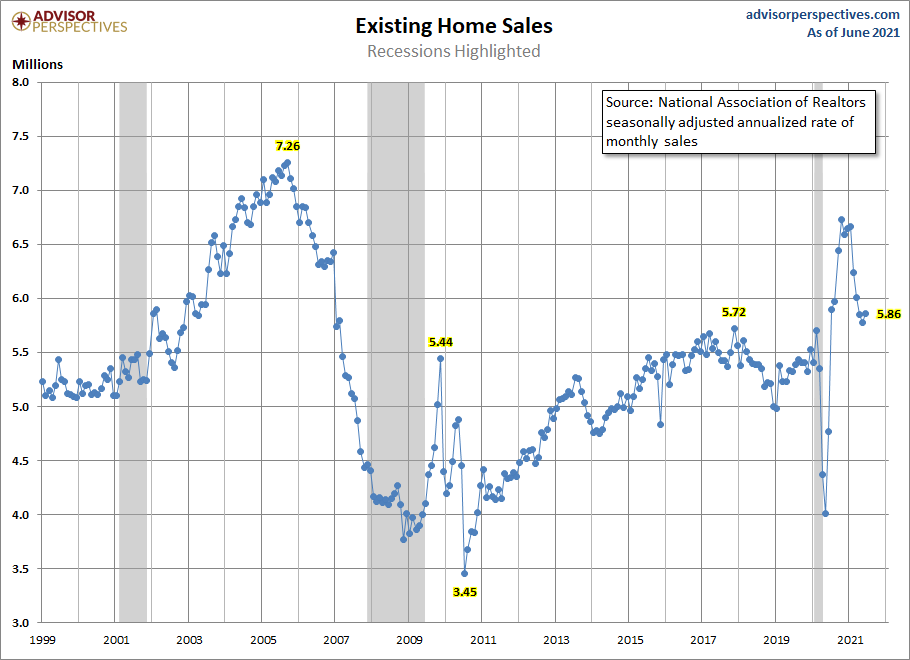
The National Association of Realtors reported existing home sales for the month of June were under their estimates slightly. The seasonally adjusted annual rate of 5.86 million achieved in June was a bit better than my expectations, ending four months of declines.
If existing home sales were getting noticeably weaker, we would expect the sales trend to be around 5.3 million, which would be back to 2019 levels. But that is not what is happening. Every single existing home sales print this year indicated an annual rate of sales higher than the total existing-home sales in 2020.
As I anticipated, Americans are buying more homes with mortgages in the years 2020-2021 than any single year from 2008-2019. The years 2022-2023 will be the sweet spot years because ages 30 to 31 will make up the biggest age group in history.
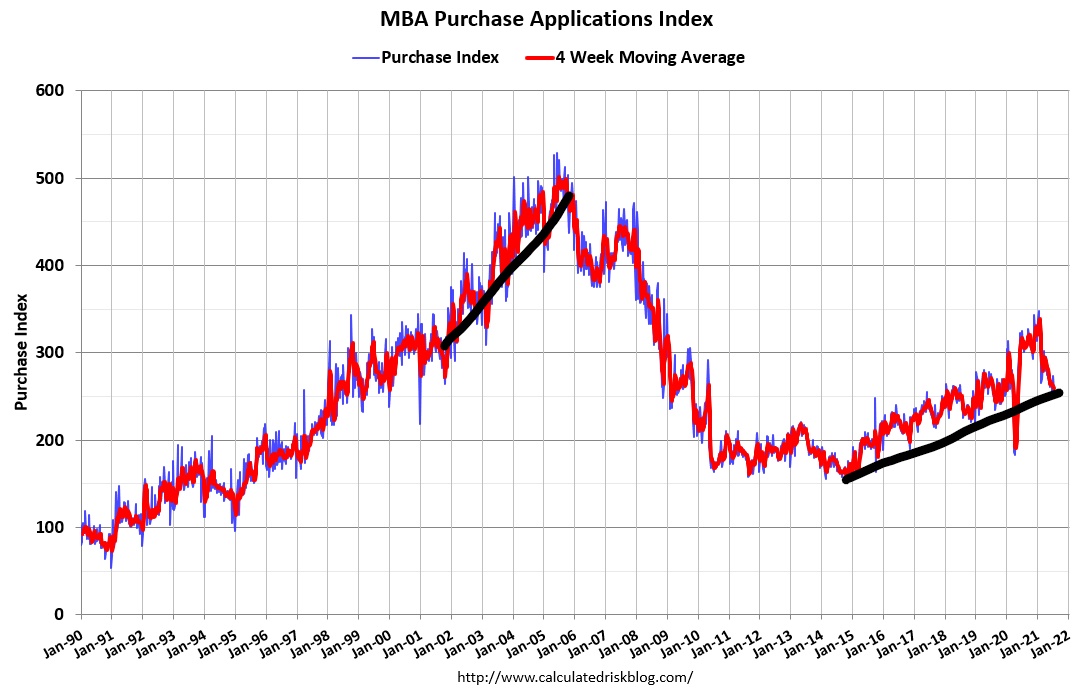
Almost four months ago, I wrote that based on the year-over-year growth in purchase applications, the housing market should have a few existing home sales prints under 5,840,000. I wrote:
“The rule of thumb I am using for 2021 is that existing home sales if they’re doing good, should be trending between 5,840,000-6,200,000. This, to me, would be considered a good year for housing. This also means that we should have some prints above 6,200,000 like we have had already and below 5,840,000, which hasn’t happened yet. We ended 2020 with 5,640,000 existing home sales, which was only roughly 130,000 more than 2017 levels.”
I have been anticipating some prints under 5,840,000 for 2021, but thus far only one print fell below this level. The COVID-19 shutdowns and subsequent rebound in economic activity have taken us on a roller coaster ride, and this is especially true for housing. When looking at the data for the last 12 months we need to make some adjustments in the numbers and essentially ignore the year-over-year data in order to understand the trends going forward.
We will see negative year-over-year sales data in the second half of 2021 like we are seeing currently in the purchase application data.
Existing home sales ended 2020 at 5,640,000. COVID-19 caused that number to be lower than it would have been otherwise. If we followed the sales trend we started in February, before the Covid crisis, we can project that sales would have ended the year higher. We did see “make-up demand” in the latter part of 2020 and some of that “extra” demand has spilled into 2021.
This is why I discounted to a degree the positive growth trend in purchase applications we had in the first six weeks of the year as being indicative of an overall trend. During that period, purchase applications were up 17%, year over year using hard comps. As strong as that looked, trust me when I say that a lot of adjustments have to be made with housing data to understand what the trends are going forward.
Both the extremely high level of year-over-year growth in the latter part of 2020 and early part of 2021 and the year-over-year declines that we will see in the later part of 2021 should essentially be ignored. What we can expect for the remainder of 2021 is solid replacement buyer demand but no spike in mortgage purchase originations like we would see if housing was really booming, such as we saw in the years 2002-2005. Also, seasonality has kicked in with the purchase application data.
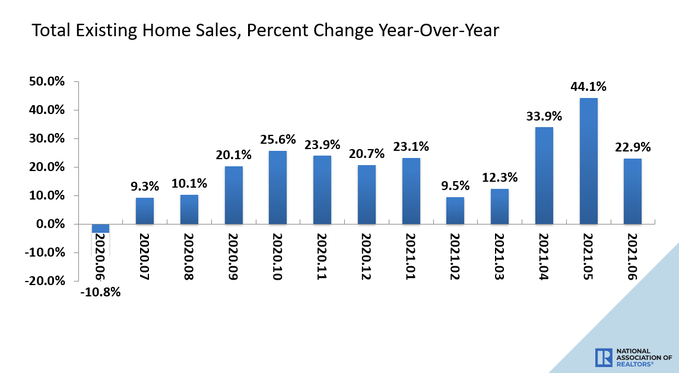
From NAR: Sales climbed year-over-year, up 22.9% from a year ago (4.77 million in June 2020).
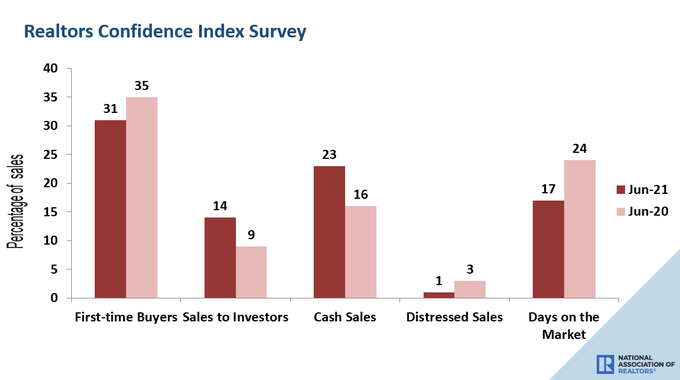
Inventory is still an issue in the existing home sales market. We need days on the market to grow much higher than it is today. I believe this will happen in time but thus far we have had no growth in this data line even with the rise in total inventory levels. This is why I call this the unhealthiest housing market after 2008.
At that time we had a collapse in demand and mounting foreclosures. Today, we have the exact opposite. The shortage of homes on the market means supply is not meeting demand, leading to multiple bids per offering becoming the standard. Inventory should pick up, but we want total inventory levels to stick and go higher next year, not the seasonal rise and fall that we see in spring, summer, and then fall and winter. I talk about that here.
From NAR: First-time buyers accounted for 31% of sales in June; Individual investors purchased 14% of homes; All-cash sales accounted for 23% of transactions; Distressed sales represented less than 1% of sales; Properties typically remained on the market for 17 days.
My biggest concern for 2021 was that home prices would overheat. As I stressed in my interview with Bloomberg Financial at the start of the year, this unhealthy home price growth is not based on recording-breaking demand but instead on lack of inventory.
Supply-based inflation is a terrible thing. Buyers are forced to pay more due to a shortage of the product. Inventory levels have been falling since 2014 and purchase applications have been rising. The years 2020 to 2024 have the best demographics for housing ever, so even if demand picks up a couple hundred thousand, that inventory channel would go lower, with the trend for decreasing inventory, you can see what supply shortage inflation is.
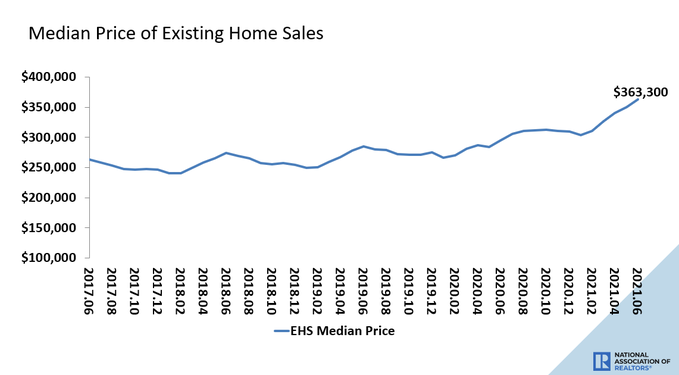
From NAR: The median existing-home price for all housing types in June was $363,300, up 23.4% from June 2020 ($294,400), as every region recorded price jumps. This marks 112 straight months of year-over-year gains.
I anticipated that during the period of 2020 to 2024, when our demographics were solid for home buying, a cumulative nominal home price growth of up to 23% would be ok for a stable, healthy market. Adjusting to inflation, that level of price growth would be manageable with rising wages. We are already seeing 23% price growth in the first two years. The two-year growth trend will surpass my five-year outlook. In a perfect world of models we would want flat to negative pricing for the next three years, but just like in sports, what works on paper doesn’t happen in real life.
According to the recent NAR report, existing-home sales look a little better than I expected. I anticipate a few more prints under 5,840,00 but no dramatic drops from the 5,640,000 level such as we saw from 2005-2008.
Existing home sales are on-trend to have slightly higher sales in 2021 compared to 2020. We should see 6.2 million total home sales (new + existing) every year during our housing demographic years of 2020 to 2024. If this doesn’t happen, then this would be due to something unexpected. That unexpected something is that home prices escalated out of control, and then mortgage rates rose to cut some buyers out of the market.
This could create enough of a hit on demand to bring total sales below this level. This won’t happen in 2021. Still, the price gains in 2020 and 2021 should raise eyebrows, especially since we do not see much growth in credit. As long as this scenario continues and days on the market remain at the teenager level, I will still call this the unhealthiest housing market post-2008.


