


On Tuesday, we got more confirmation that the Federal Reserve‘s biggest fear — inflation blowing up to 1970s levels — isn’t happening, according to the CPI data. Even with its most significant component, shelter inflation, keeping core CPI higher than it should be, it’s been hard to accelerate the core data.
However, with the current banking stress news and the emergency action taken by the Fed to secure the banking sector, the question now is what will drive mortgage rates: inflation data, recessionary data, or something else we don’t even see coming?
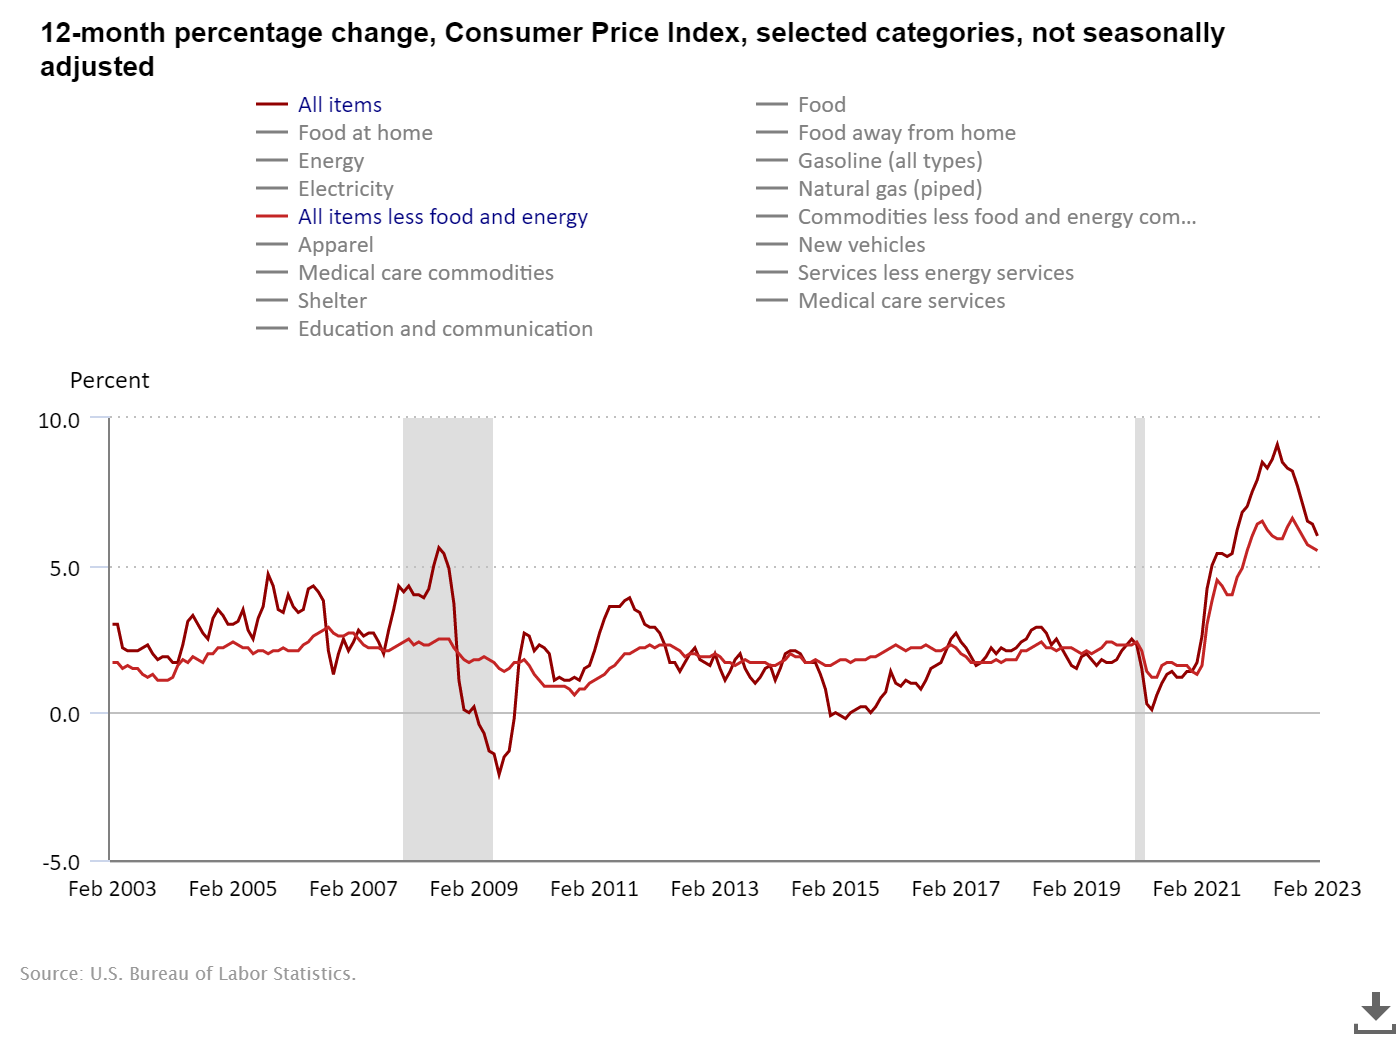
As we can see from the chart below, while the inflation data is cooling down, it’s not cooling down fast enough for the Fed.
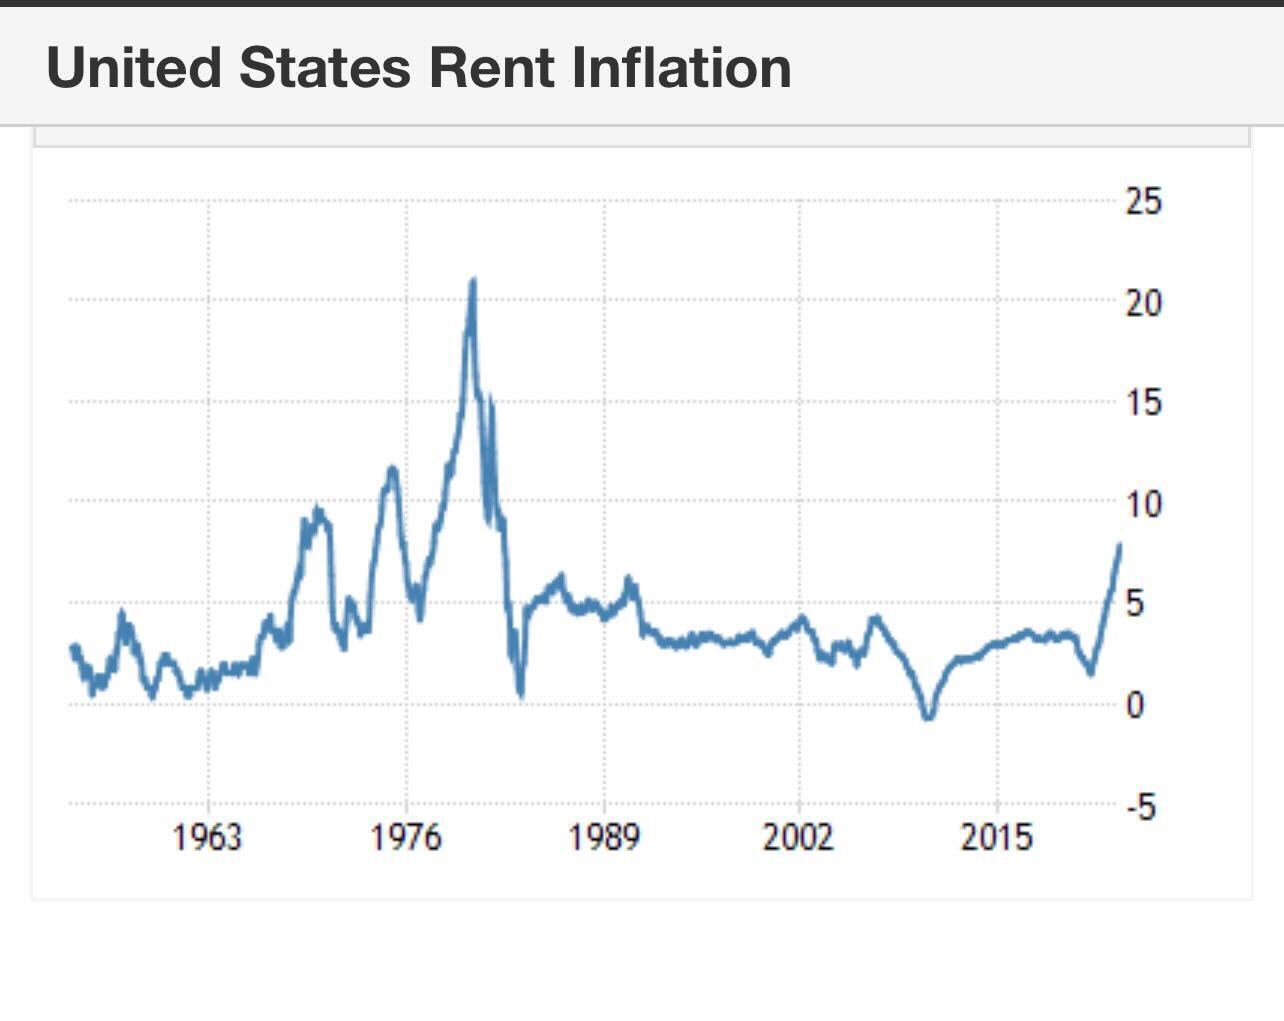
Of course, if the Fed keeps talking about 1970s-style entrenched inflation, I will keep telling them to leave their disco pants at home because this isn’t the 1970s. To even have something remotely close to 1970s inflation, you need a massive housing boom. As you can see below, rent inflation took off in the 1970s.
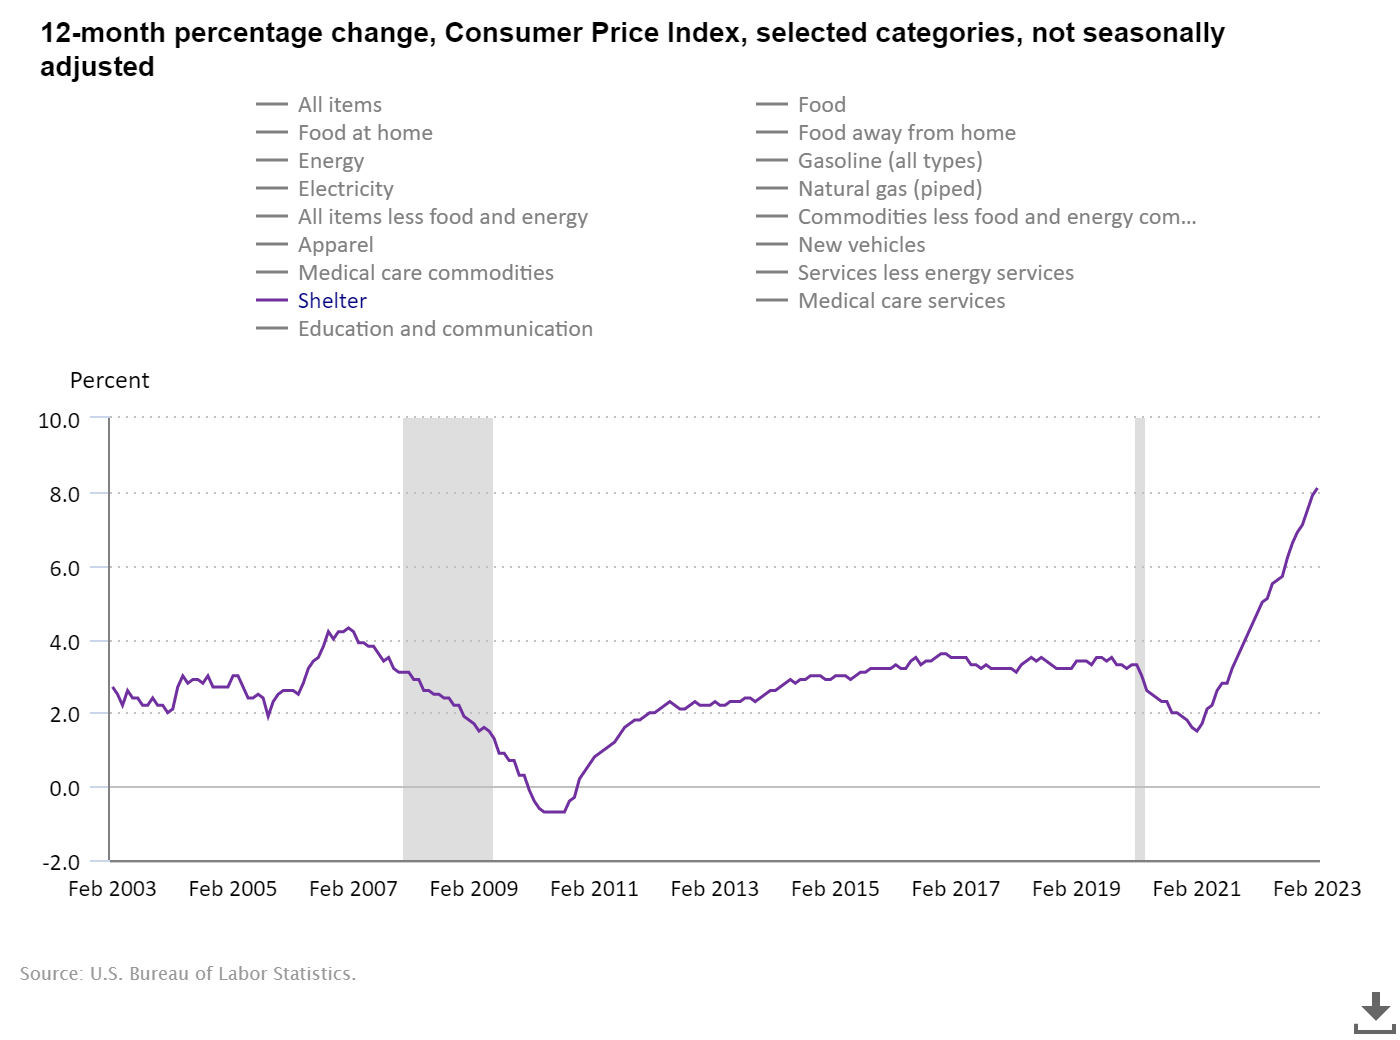
The shelter component of the CPI data has a weighting of 44.4%, and it currently lags today’s reality big time. The chart below shows that shelter inflation is still rising.
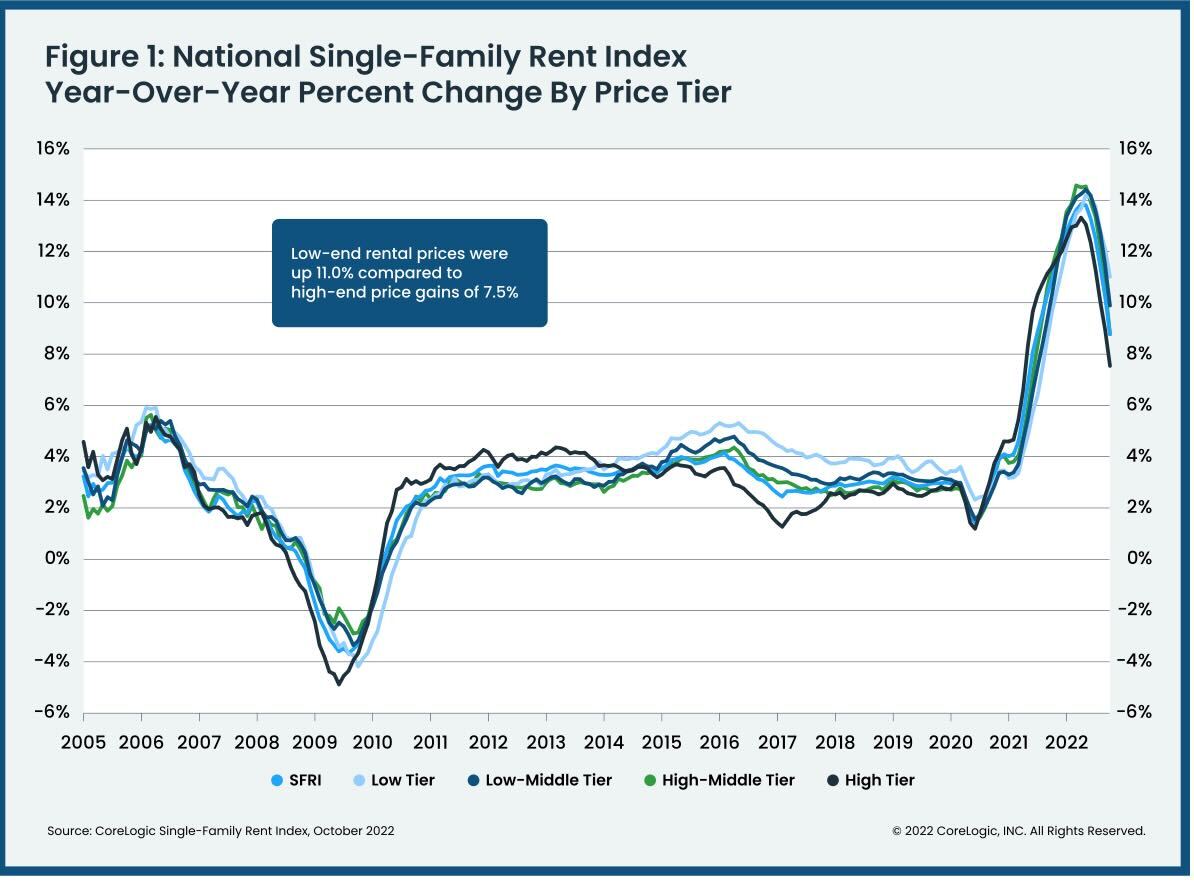
However, as the CoreLogic rental survey data below shows, the shelter inflation growth rate is collapsing, which is much different than the CPI shelter report today. Almost everyone understands this: the growth rate of core CPI on a real-time basis is much lower than what the report says because it lags badly. From the CoreLogic rental survey:
Read more about why today doesn’t compare to 1970s inflation here.
From the CPI report: The Consumer Price Index for All Urban Consumers (CPI-U) rose 0.4 percent in February on a seasonally adjusted basis, after increasing 0.5 percent in January, the U.S. Bureau of Labor Statistics reported today. Over the last 12 months, the all items index increased 6.0 percent before seasonal adjustment.
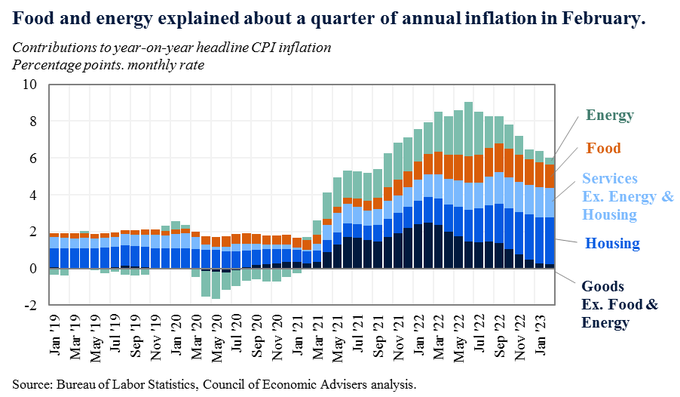
Inflation data charts can help visualize what is happening. As you can see, the energy data is cooling off as oil prices aren’t blowing up higher anymore, and we have more difficult comps to deal with as the Russian invasion pushed oil prices much higher last year.
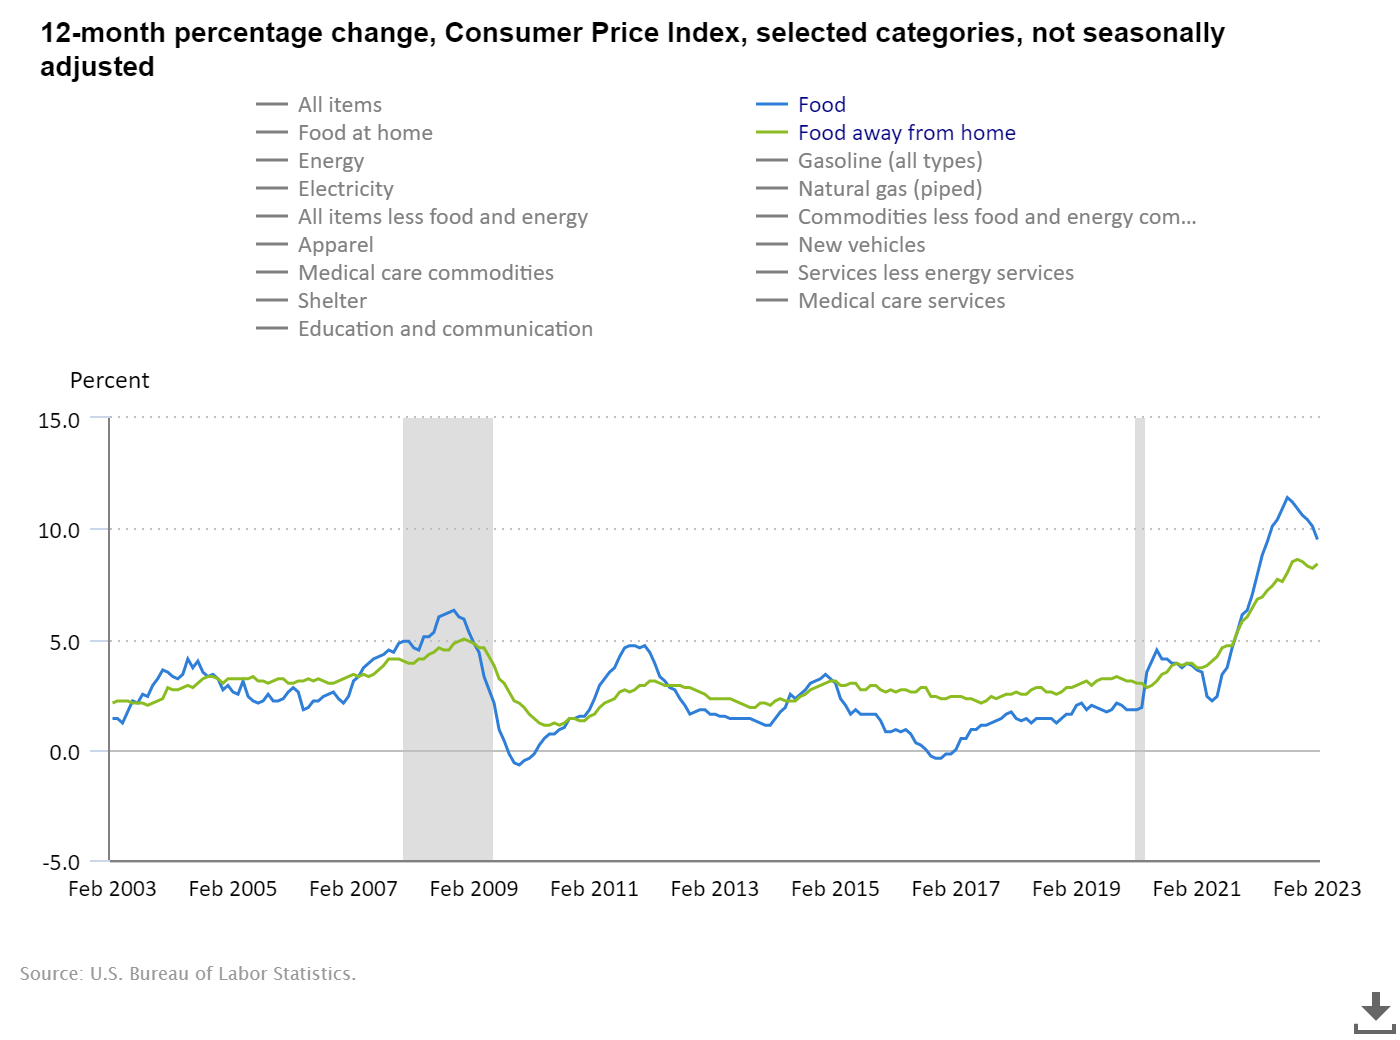
As shown below, the food inflation rate peaked in late summer of 2022 but has yet to fall with more speed, as energy has. Of course, energy and food inflation are headline inflation. The Fed cares about core CPI and PCE inflation, which excludes food and energy inflation, because these tend to be very wild at times.
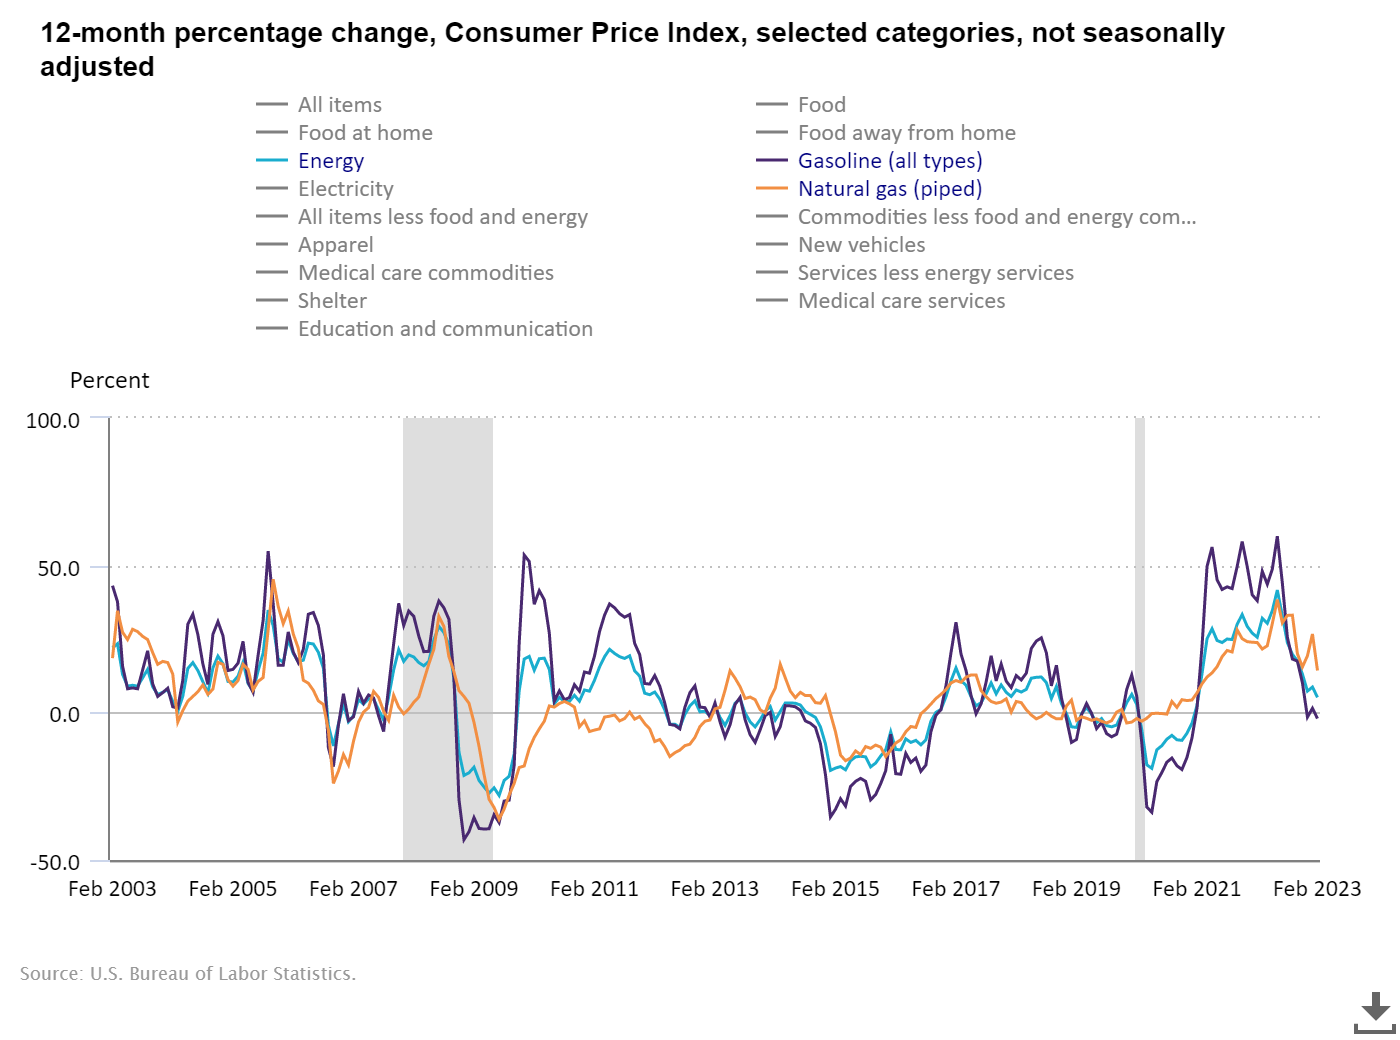
Here is a more extensive look at all the inflation data, broken into different categories; you can see why it’s hard for core CPI to take off if shelter inflation fades in the data going out.
However, service inflation data has been getting stronger month-to-month as the economy is still expanding and jobs are still in make-up demand mode.
What will drive mortgage rates now?
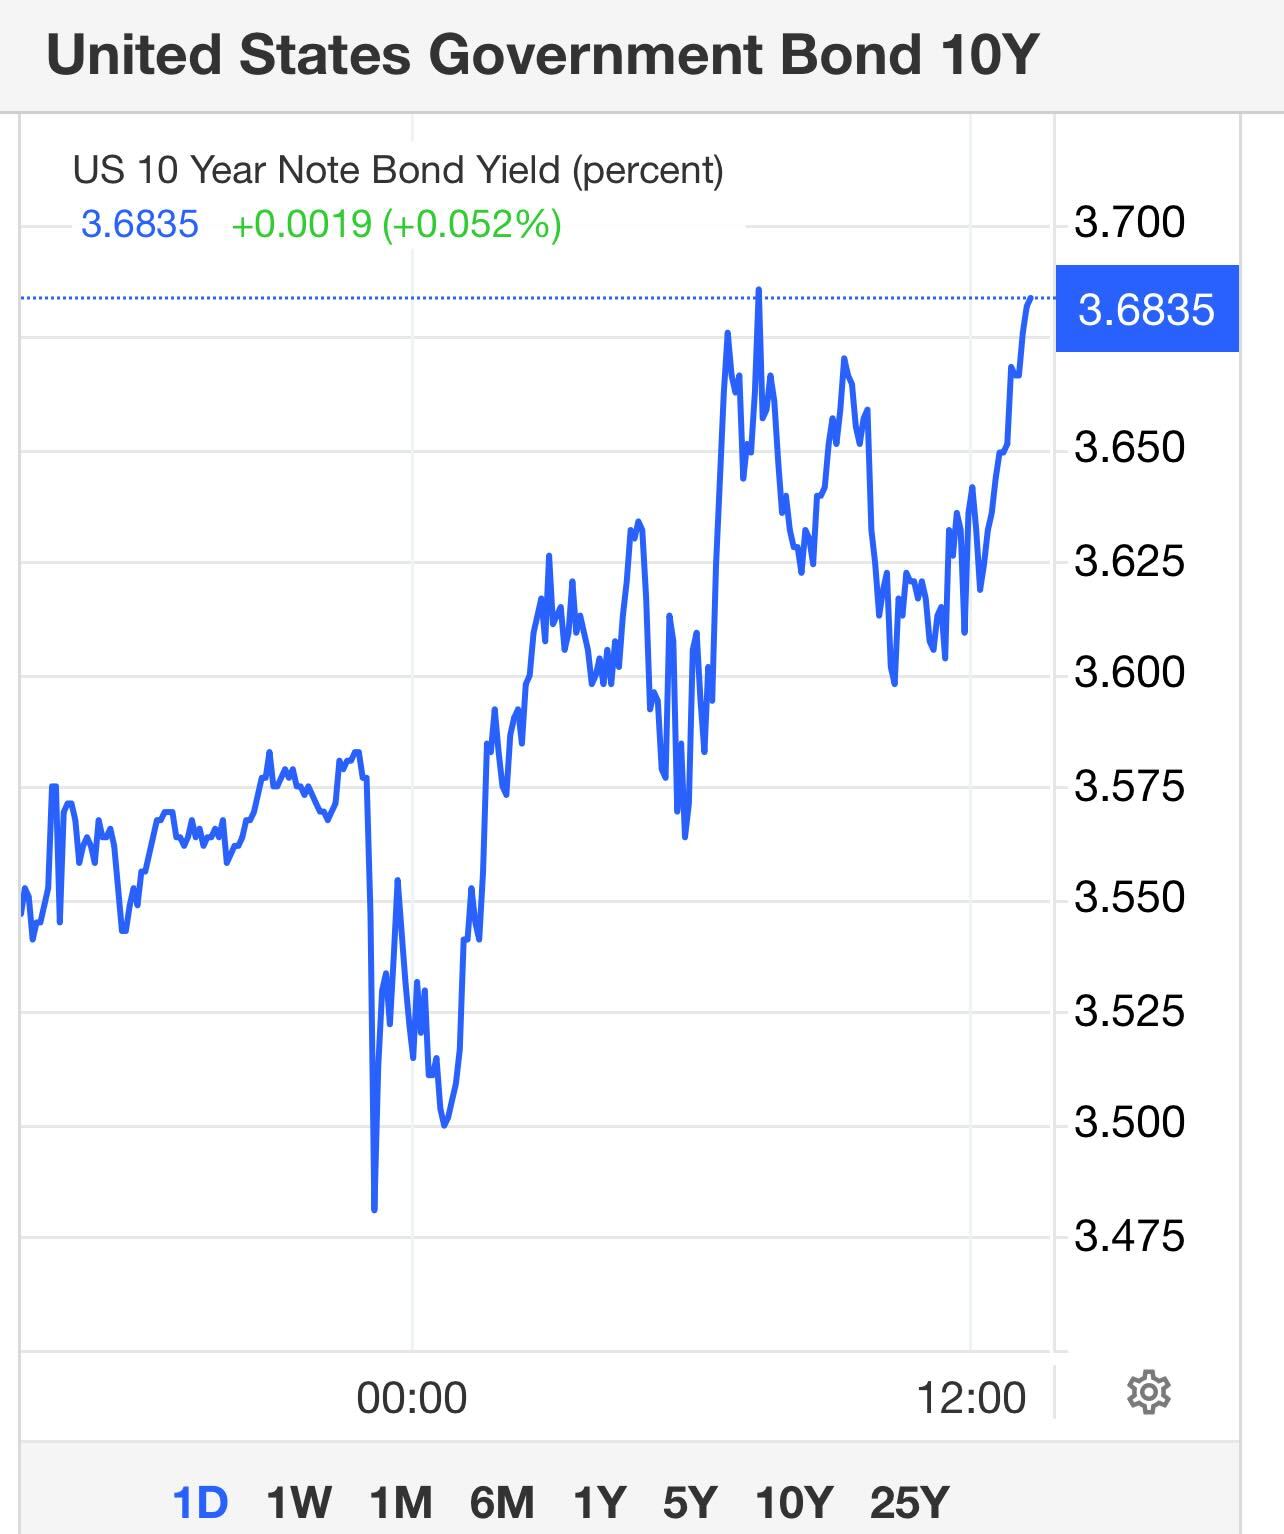
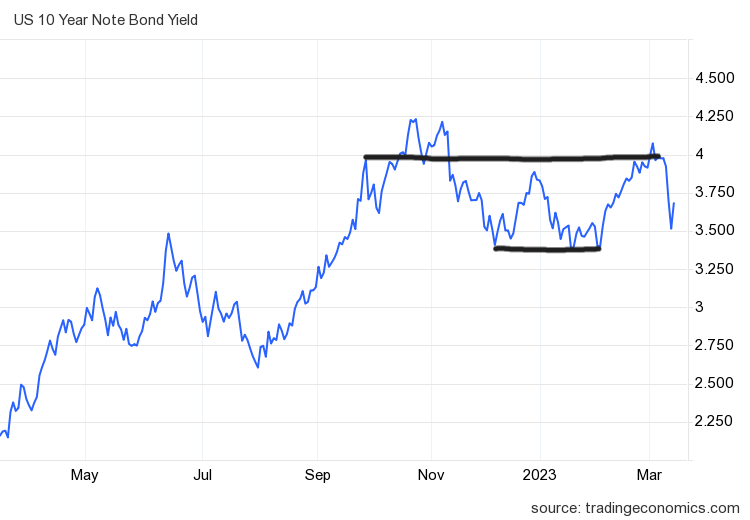
We have had a crazy three days in the bond market. The banking collapse drove money into the bond market, taking the 10-year yield down to my critical level of 3.42% intraday, only to bounce back higher right after that.
As of the close on Tuesday, the 10-year yield went back to 3.68%. A key thing to remember with a lot of 10-year yield charts is that they show what happens at the close. We’ve had a lot of hot parties in the bond market that don’t show up here.
If, after the wild weekend of bank closures, you felt that mortgage rates should have gone lower on Monday, realize that the banking sector is stressed and credit is getting tighter. Imagine if Freddie Mac and Fannie Mae were publicly traded companies with falling stock prices — the mortgage credit world could have gotten even tighter than we have seen today.
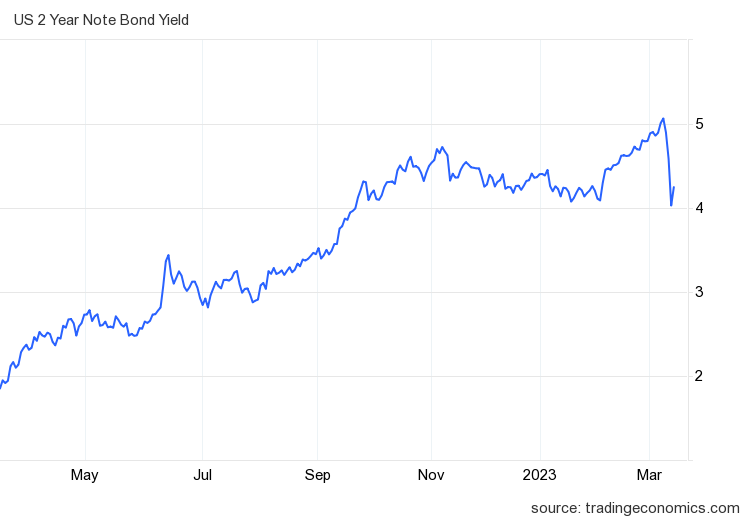
After taking emergency action this weekend to stabilize the banking sector, the Fed might pull back on their aggressive talk on rates, but for them to pivot, they need more economic pain on the labor front. Let’s start tracking the two-year yield on this front.
The 6% Fed funds crowd that were big talkers on Monday, March 6, got buried on Sunday, March 12. We had a historic rally in the two-year yield, and a big part of this was that hedge funds were very short on the bond market recently and got burned badly. This created an extra wave of buying.
However, the short-term rate isn’t what drives mortgage rates; it’s the long end, which means it’s really about the 10-year yield. Based on my 2023 forecast and what I see in the labor market, the 10-year yield and mortgage rates look about right to me.
My 2023 forecast has a 10-year yield range between 3.21%-4.25%, which means 5.75%-7.25% mortgage rates, assuming the spreads are wide. In the Housing Market Tracker articles, I talk about the key levels of the 10-year yield at 3.42% and 3.95%. Both of these levels have held up so far this year. This is why we created the tracker article each week to try to make sense of all the madness occurring today.
We need to take a minute to consider the madness that happened over the last week and what other banking risks we have, as more and more commercial loans could go into default over the next year. We have only seen a few reports of this happening so far; however, commercial loans are still at risk for more defaults.
With more people working from home, the need for office space has gone down dramatically, so this is one area to keep an eye on over the next 12-24 months.
The inflation data came in a bit hotter than expected on the service side of the CPI data, but as we can see, the growth rate of core inflation is cooling off and not accelerating higher like it was in 2022. The Fed is more concerned about service inflation at this point.
In the wake of the Fed’s aggressive rate hikes and the resulting turmoil, we now need to be more mindful of economic damage coming out of left field. A good example of this is that nobody talked about the risk to UK pension funds before they blew up. And nobody thought we would need emergency government intervention to keep U.S. regional banks from going under. However, both things happened, so now we must consider what is next.
We will soon hear the Fed members address this topic and we’ll see if the recent banking collapse will change their tune on more aggressive rate hikes at this stage. Outside of that, it’s about the labor market and jobless claims for the Fed.
If jobless claims start to rise closer to my crucial level of 323,000 on the four-week average, then I believe the long end of the bond market, which never believed in the 1970s inflation premise, will head lower.
The Federal Reserve has talked about needing higher unemployment to help their goal of fighting inflation. With the recent banking crisis, payroll money was at risk, so in theory, they could have allowed jobs to be lost. Instead, they invoked emergency powers to ensure people wouldn’t lose their jobs. Remember this when the next job-loss recession eventually happens.
Now, however, with jobless claims low and job openings high, we just aren’t there yet. I’ll be addressing this in more detail in the next HousingWire Daily podcast, because we can’t let the banking crisis slide, especially now that Moody’s has downgraded the banking sector to negative.


