


Here’s the housing market rundown for the last week:
- Purchase application data had a solid week-to-week gain of 25%. That’s a big jump, but context is critical.
- Housing inventory decreased by 566 units, which is not a significant decline.
- Mortgage rates fell, but the bond market didn’t break what I see as a critical level, so for now, stabilization is more important.
Last week’s housing market data provided mixed news. Purchase application data had a solid week-to-week print of 25% growth, but the more valuable metric is that the year-over-year declines were the lowest in many months. Mortgage rates ended the week at 6.15%, but the 10-year yield didn’t break the critical level I was looking for and reversed higher on Friday.
Weekly housing inventory fell, but not by much. I want to see total inventory back at the 2019 level — this would mean NAR data breaking above 1.52 million. In the last existing home sales report, we hit 970,000. I believe we can have a more functioning housing market if inventory rises to that level, but we still have a long way to go. We don’t want inventory to stall during this time of the year; it should grow into spring.
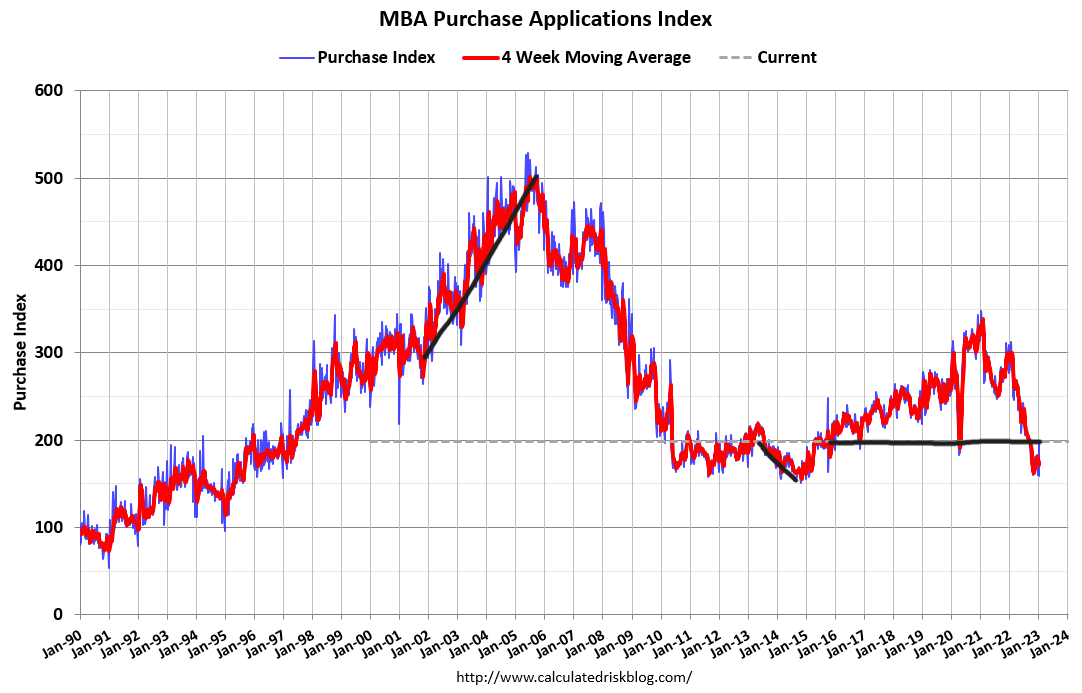
Purchase application data
Last week we saw a big jump in purchase application data of 25% week over week. Normally this would be epic news because we rarely see 25% week-over-week growth. However, we need to remember that we just started the period of seasonal growth, which runs from the second week of January through the first week of May, so context is always critical.
The more important data for me was that the year-over-year decline in purchase application data was the lowest in months. The key with application data is to read the internals, especially after a waterfall dive in demand, to see when a bottom is forming.
Since Nov. 9, this data has been improving, a fact that has quietly slipped past most people because so much of the focus was on falling home prices. The internal data was starting to show a bottom forming while mortgage rates were falling.
This data line has not had a positive year-over-year print since May 19, 2021. COVID-19 has done a number on this data line, so a lot of adjustments need to be made to understand it better.
The year-over-year purchase application data is the most important because that is the new volume growth. Since we are working from the mother of all low bars, any change we might see this year needs context. However, considering mortgage rates haven’t cracked below 6% yet, it’s encouraging to see a stabilization forming with rates between 6.04% – 7%.
We want to focus on this data from now until the first week of May. After May, total volumes always fall. Don’t forget that purchase application data looks out 30-90 days at minimum, so it will take time for the sales data to reflect what’s happening here. For now, consider this just stabilization.
Weekly housing inventory
The downside of the past week is that weekly housing inventory declined slightly. However, I will look at the bright side and say that the past two weeks have seen a stabilizing of inventory. The Altos Research weekly housing inventory data shows that two weeks ago, inventory grew by 1,339 units and then declined by 566 units last week. Hopefully, we will see the traditional rise in inventory for the spring faster than we saw last year.
- Weekly inventory change (Jan. 13 -Jan. 20, 2023): Fell From 472,688 to 472,122
- Same week last year (Jan. 14-Jan. 21, 2022): Fell from 283,656 to 276,865
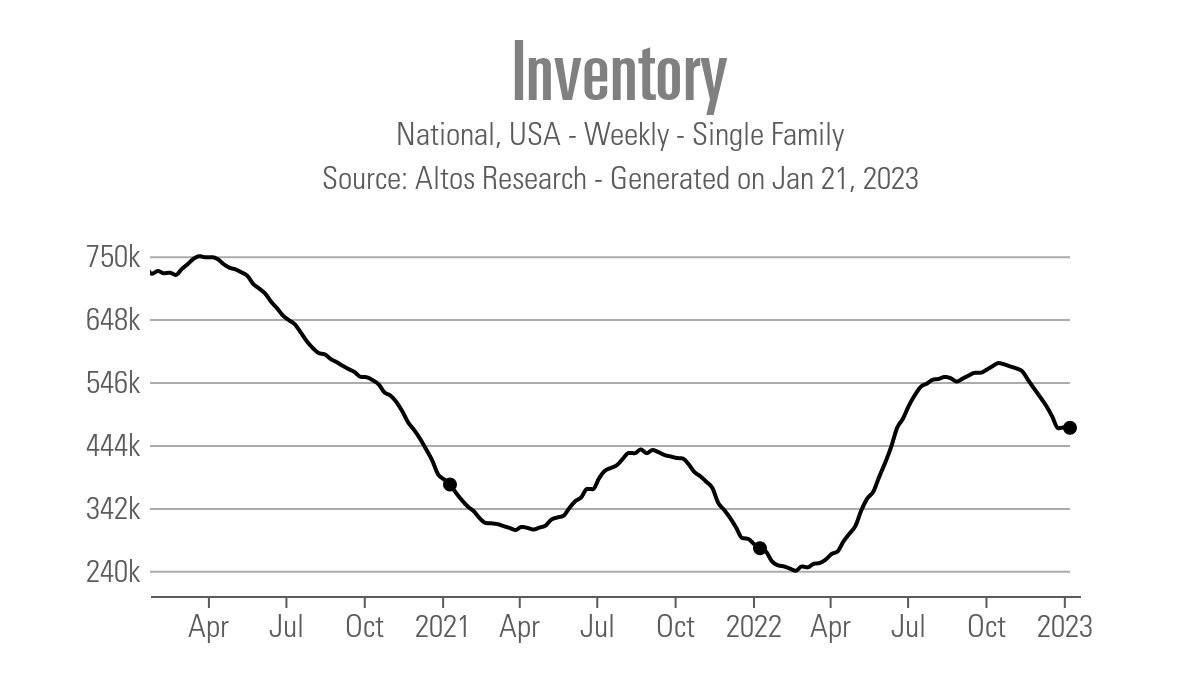
In June, I predicted that as long as mortgage rates stayed high, weakness in demand over time could create more inventory, and we could get back to 2019 levels of inventory in 2023, meaning inventory breaks over 1.52 million.
One week after that prediction, the new listing data declined faster and earlier than usual. By December, this led to total inventory levels breaking under 1 million. Even getting inventory back to 2019 levels would still mean total housing inventory was historically low.
As days on market grow, more houses will naturally stay on the market longer, which can increase total inventory levels, similar to what we saw last year. However, it’s going to be tough getting above 1.52 million active listings if new listing data declines in 2023.
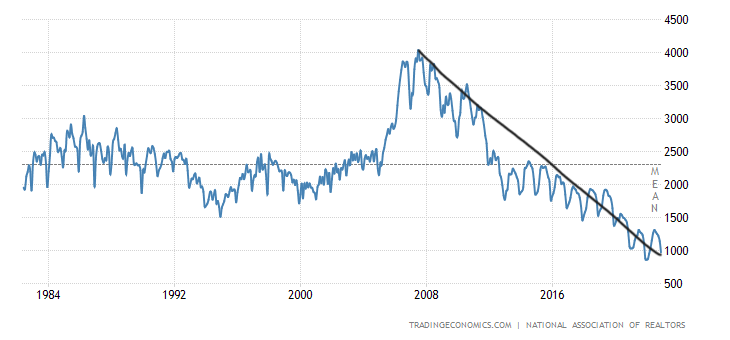
As you can see below in the NAR total inventory data for 2022, Inventory grows each year during the spring and summer, then traditionally declines in the fall and winter.
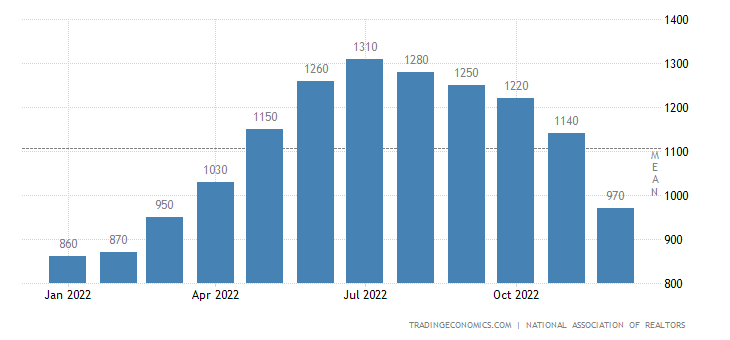
Given the seasonality factor, it’s very important that we get traditional new listing growth every year to keep the housing market working as normal. In 2020, due to COVID-19, and then again in 2022, due to much higher mortgage rates, new listing data fell noticeably, which is a sign of an unhealthy housing market.
In 2020, new listing data came back fast as people grew comfortable listing their homes during COVID-19. Now, it’s about mortgage rates and affordability, not a global pandemic.
10-year yield and mortgage rates
Last week, mortgage rates headed lower to a short-term low of 6.04%. However, the bond market guy in me just saw a test of a critical level fail, and the yield reversed higher by Friday. Mortgage rates ended the week at 6.15%.
Part of my 2023 forecast for the 10-year yield is that if the economy stays firm, the 10-year yield range should be between 3.21%-4.25%, meaning mortgage rates between 5.75%-7.25%. With economic weakness, bond yields could quickly get down to 2.72%, which could take mortgage rates near 5%.
Right now the economic data is still firm, and jobless claims are still low, even though January isn’t the best month to take jobless claims data too seriously. All in all, the first few weeks of the year look about right to me for the housing market.
The marketplace believes the Federal Reserve rate hikes are almost done, and they should be cutting rates toward the end of the year. The Fed wants to do two or three more 0.25% rate hikes and call it quits. I think the Fed should just call it quits — this way, you have a better shot at keeping short-term rates higher for longer.
The week ahead
Today, the Conference Board released its leading economic index, a key tracker for all market participants, and it hasn’t been showing bullish economic trends for a while now. In July, I presented my six recession red flag model to the Conference Board right before I raised my sixth recession red flag based on the index.
Other important housing market reports this week will be durable good orders, new home sales and pending home sales. Pending home sales will be interesting since a lot of recent housing data has been positive. This might be the last pending home sales report that doesn’t account for the better purchase application data — it might be one month too early. However, we could see a tiny bounce off the bottom. We’ll know on Friday.
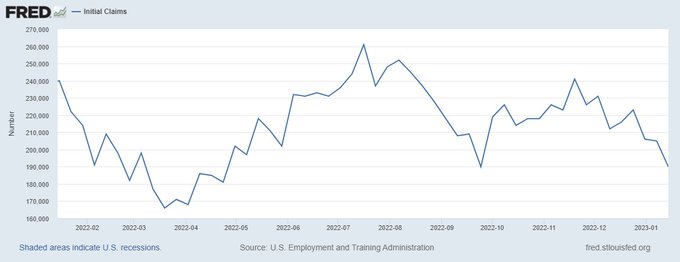
As always, keep an eye out on jobless claims Thursday morning. The last few weeks have been good in this data line as it’s been trending down. Last week, the headline jobless claims data broke under 200,000 again, down to 190,000, showing how solid the labor market is.
Just remember, when you see a lot of layoff announcements, this doesn’t necessarily mean people file for unemployment claims right away. Especially when it comes to layoffs in tech companies, those might need more time to filter into the system.
My Fed pivot model needs jobless claims to break over 323,000 on a four-week moving average. As you can see below, we are nowhere close to that, but the bond market should get ahead of the Fed before the turn.
Overall, last week’s data was good, but not great, for the housing market. I would like to have seen the inventory grow, not decline, but I will take a slight decline as a small victory. The 10-year yield not breaking that critical level isn’t too shocking, but seeing that level get a good test was exciting.
Purchase apps had a significant week-to-week gain, but remember, context is critical with this data line; we want to take this one week at a time and read the data line correctly and not overhype anything too much.


