


Home prices aren’t crashing, despite what the housing bubble boys are saying. In fact, home prices have firmed up higher recently.
The housing bubble boys are a crew that from 2012 to 2019 screamed housing crash every year. They went all in during COVID-19 in 2020, doubled down in 2021 as the forbearance crash bros but really bet the farm on a massive home-price crash in 2023 after the most significant home sales crash ever in 2022.
Well, it’s June 9, 2023, and home prices have been firm month to month, not showing anything that resembles the housing bubble crash years. Those who know my work over the last 10 years know that I have Batman/Joker relationship with the housing crash people, because they never stop. I mean, it’s year 11 now of the housing bubble 2.0 crash.
Each year is different, but here are some reasons they gave for home prices to crash over the past 11 years:
- 2012 – Shadow inventory
- 2013 – Higher mortgage rates
- 2014- QE ending in October
- 2015- Manufacturing recession
- 2016- Home prices got back to the bubble high
- 2017 – No good reason
- 2018- 5% mortgage rates (Start of the bubble crash for sure)
- 2019 – Home-price growth was cooling off
- 2020- COVID-19
- 2021 – Mortgage forbearance
- 2022- 7% mortgage rates
- 2023- Historically low housing demand
The point of this article is not to focus on the years 2012-2021, but on how crazy the housing data has been since 2022 and when the housing market changed from a historic crash in demand to stabilization.
In 2022 it was all about finding a point in time when I thought mortgage rates would fall, which was key to understanding how the purchase application data would react to lower mortgage rates.
We have had plenty of times in the previous decade when mortgage rates fell and demand improved, but that was with a lot lower mortgage rates. In 2022, mortgage rates got as high as 7.37%, so the question was: how low do rates have to go for housing demand to get better?
But first, let’s start with some key dates in 2022.
On June 16, 2022, I put the housing market into a recession, which is where housing demand, housing jobs, housing income and housing production all drop. We can see this over the last year as jobs are being lost in the industry, incomes are falling due to less transaction volume, housing demand collapsed and housing permits fell since the builders had a backlog of homes to work off.
Then on Aug. 5, 2022, a few days after I presented to The Conference Board, I raised my sixth recession red flag for the overall economy. My recession red flag model doesn’t say we are in a recession, but means we should be more mindful to track economic data at this stage, especially what can lead to higher jobless claims. According to this model, the U.S. economy is still not in a recession.
Now begins the journey to stabilization in housing data.
When did the 10-year yield peak?
The 10-year yield is central to all my economic work, but trying to find a top in 2022 was very challenging due to the market conditions where bond yields rose so fast and the strong dollar put so much stress on the world markets. For instance, England almost lost its pension funds, and Japan needed intervention for theirs. Even the IMF was begging the U.S. to stop hiking rates.
For me, 4.25% on the 10-year yield was the top. On Oct. 27, 2022, I made a case for lower mortgage rates using one of the Fed’s critical recessionary indicators: the 3/10 bond yield inversion. That was key because historically the next big move in yields would be lower.
Not only did I hold that line toward the end of 2022, but it was also the staple range in my 2023 forecast. In that forecast, I wrote that if the economy stays firm, the 10-year yield range should be between 3.21% and 4.25%, equating to mortgage rates between 5.75% and 7.25%.
I have also stressed that it would be hard for the 10-year level to break below 3.37% and 3.42%. I call it the Gandalf line in the sand: “You shall not pass.” Now, if jobless claims break over 323,000k on the four-week moving average, the 10-year could break under 3.21% and get toward 2.73%. That could send mortgage rates under 6%.
Let’s look at the 10-year yield and add the CPI inflation growth. So far, as you can see, the forecast from the peak of 4.25% has stayed true, and we haven’t been able to break below the critical line in the sand either, indicated by the red line below.
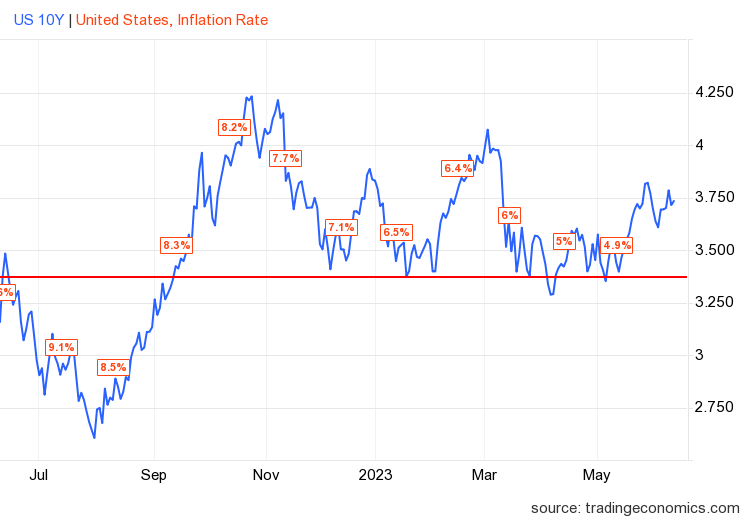
Mortgage rates ranged from 7.37% to 5.99% during this period, and how the market reacted to them changed the dynamics of the housing discussion and home prices. That is the next step of this process.
Purchase application data
The housing market began to change starting Nov. 9, 2022, from a housing sales crash to a stabilization period. That day, I wrote an article about how bad the home sales data was getting due to the affordability hit and that existing home sales should get down toward 4 million and below. This is key because it’s rare since 1996 to get sales below 4 million and we have many more workers now than in previous cycles.
With that in mind, I wanted to see how purchase application data would act. From November until Feb. 3, most weekly prints were positive once you exclude some holiday prints. This was a big deal because mortgage rates didn’t need to get to 5.5%-5% to stabilize demand. Since Nov. 9, 2022, we have had 17 positive and 11 negative purchase application prints. This changed the demand aspect of housing.
It’s not like we have a booming sales market. I believe the giant existing home sales print we had in March will be the peak in 2023 unless we get some better purchase application data, which will need lower mortgage rates.

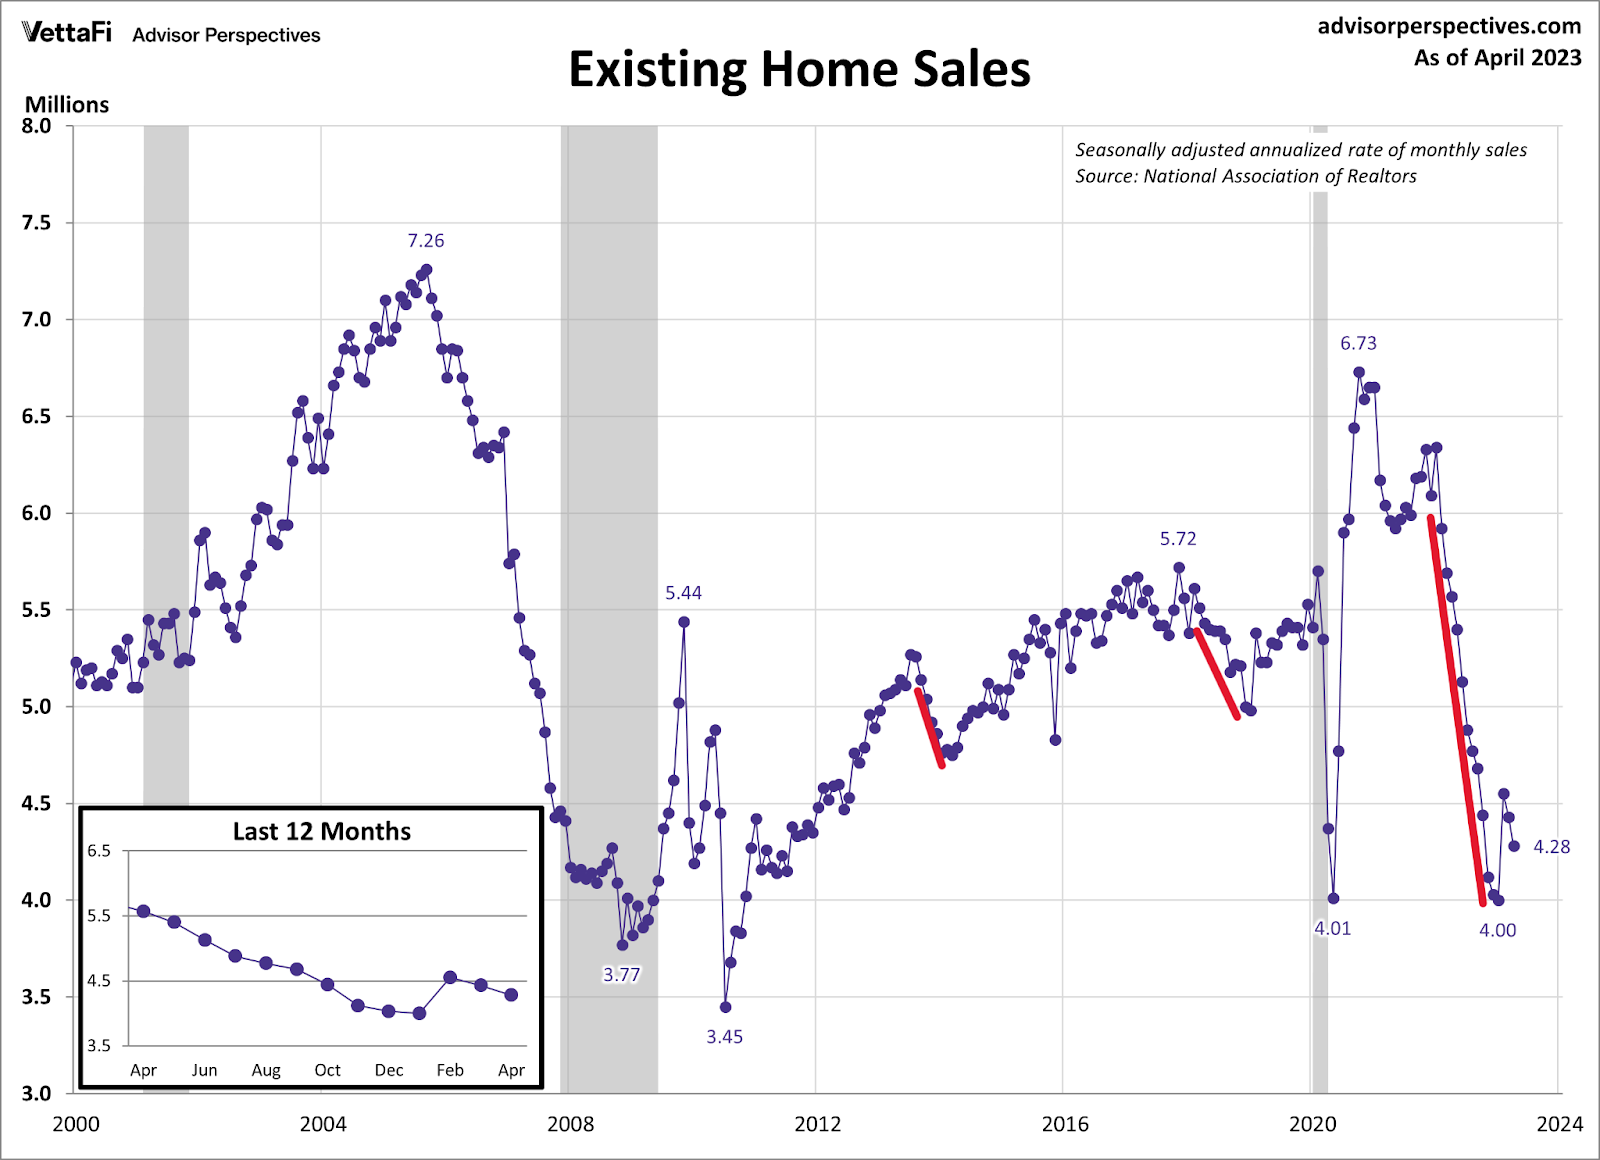
The importance of this is that 2022 had the most significant home sales crash ever recorded in U.S. history, and because of that, not even low inventory could prevent home prices from declining month to month in the second half of 2022. However, that changed once the 10-year yield peaked, mortgage rates fell, and demand stabilized. Now we can talk about the final stage: inventory in the U.S.
Housing inventory
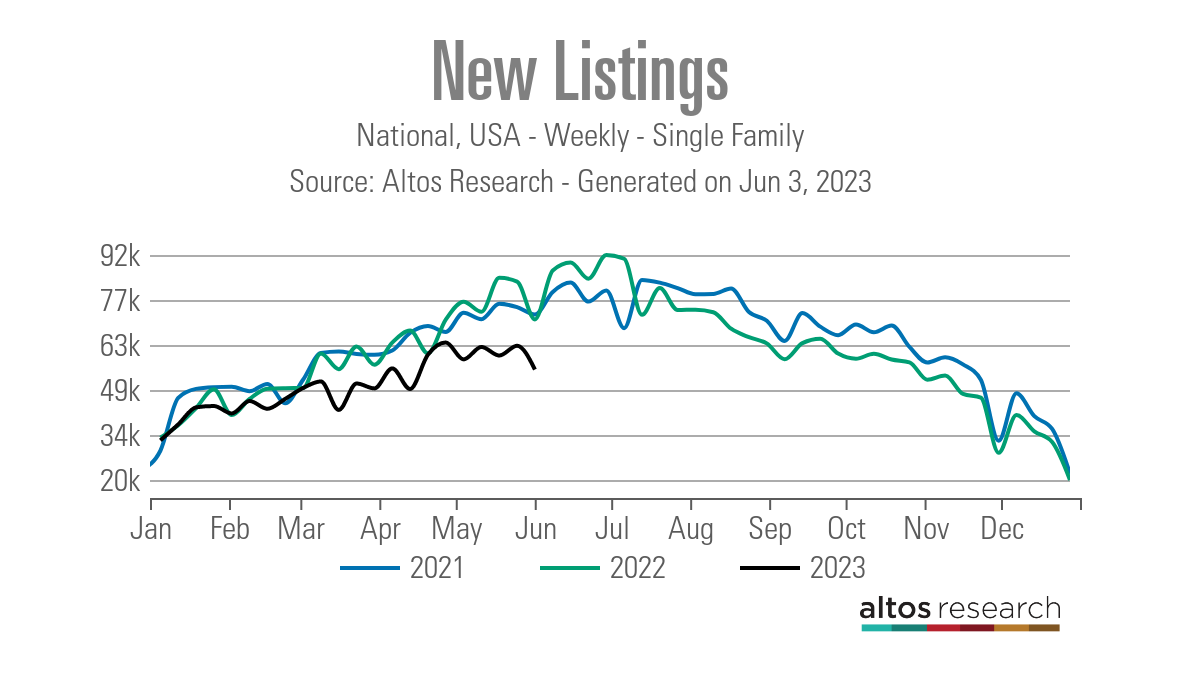
The No. 1 story in the second half of 2022 was that after mortgage rates spiked, new listing data started to go negative year over year, which was crazy because we were already working from all-time lows. This was a big deal, and the weekly Housing Market Tracker of new listing data was all over this. The weakness in the new listing data carried us all the way to where we are today in 2023 at all-time lows.
How would new listing data trending at all-time lows impact the active inventory in 2023? We know mortgage rates fell toward the end of 2022, and forward-looking demand was improving. This doesn’t bode well for vigorous inventory growth in 2023, as lower mortgage rates improve demand, which takes housing inventory off the market. This also means there will be no bubble crash in prices in 2023. The active inventory growth is so slow this year that we are heading toward negative year-over-year numbers.

This all works together because we’re watching a housing market that went from crashing in demand and inventory rising with some speed to a market that reacted better with lower mortgage rates, stabilized home sales, and slowed inventory growth. With stable demand, this chart becomes more critical. Total active listing data still is low historically.
Also, we don’t have much credit stress in the system right now. As you can see in the chart below, we don’t have the credit stress that led to the housing bubble crash years.


This article shows the historical change in one of the craziest housing periods ever recorded. We created the weekly Housing Market Tracker so you can be ahead of the lagging data and understand what is coming next. One thing is certain — it’s not a housing crash.


