


[Editor’s note: As of November 2022, we no longer use Slack, and we’re happy to share that we’ve moved to Circle for our new community platform. We will be continuing Q&As, live discussions and more in this new community platform. If you’re a member and not a part of our Circle community yet, you can click the link at the end of the article to join.]
The following Q&A comes from the HW+ exclusive Slack channel, where HousingWire’s Lead Analyst Logan Mohtashami answered questions on what to make of the latest housing data, his forecast for the rest of this year, and whether or not the housing market is returning to normal. He also addresses how he foresees the Delta variant impacting the housing market. Looking at the data, it’s not as simple as comparing year-over-year changes or even monthly changes since the past year was filled with never-before-seen situations.
The following Q&A has been lightly edited for length and clarity.
HousingWire: There’s so much happening in the housing market right now, it’s hard to stay on top of the latest data and what it means. What are the top takeaways that people should know about the market right now?
Logan Mohtashami:
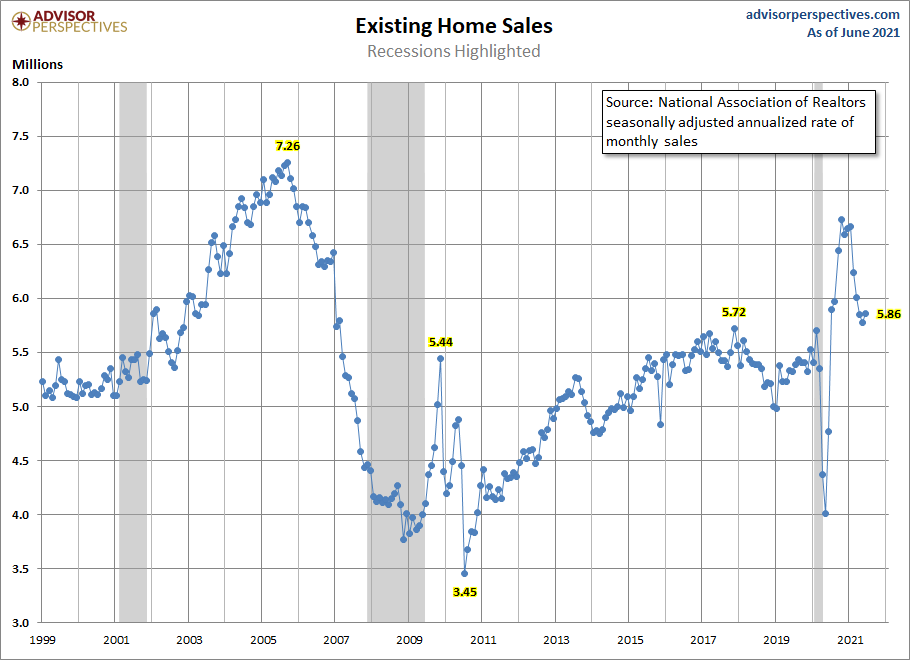
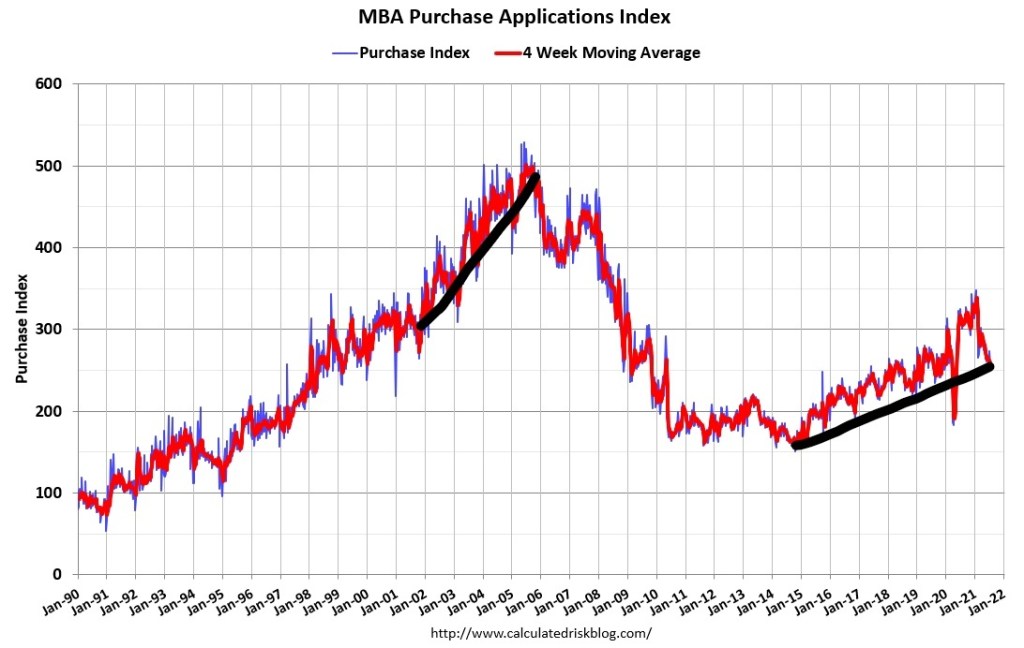
- We have a lot of crazy housing data, but when you make COVID-19 adjustments and work on the moderation from the parabolic run-up from the 2nd half of 2020, not much is happening in sales data. This looks very normal to me, especially with the existing home sales data that ended 2020 with 5,640,000, which is only 130,000 more than 2017 levels.
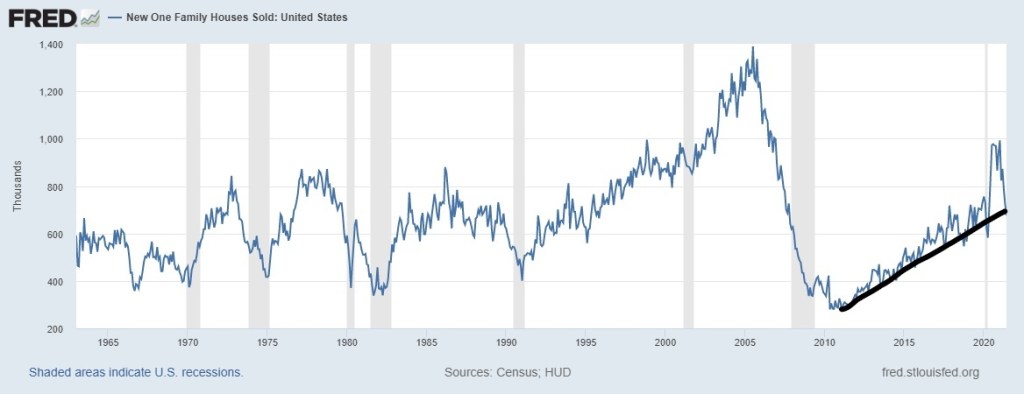
2. We see that in the new home sales market as well, which the data got extremely wild.
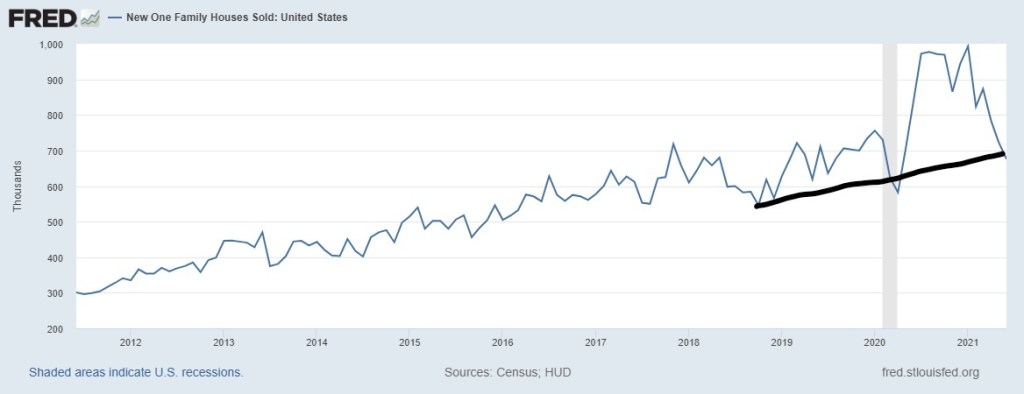
3. The uptrend is new home sales working from the weakest housing recovery from 2008-2019 is still intact even with the extremely high cost through price inflation buyers had to deal with in 2020/2021.
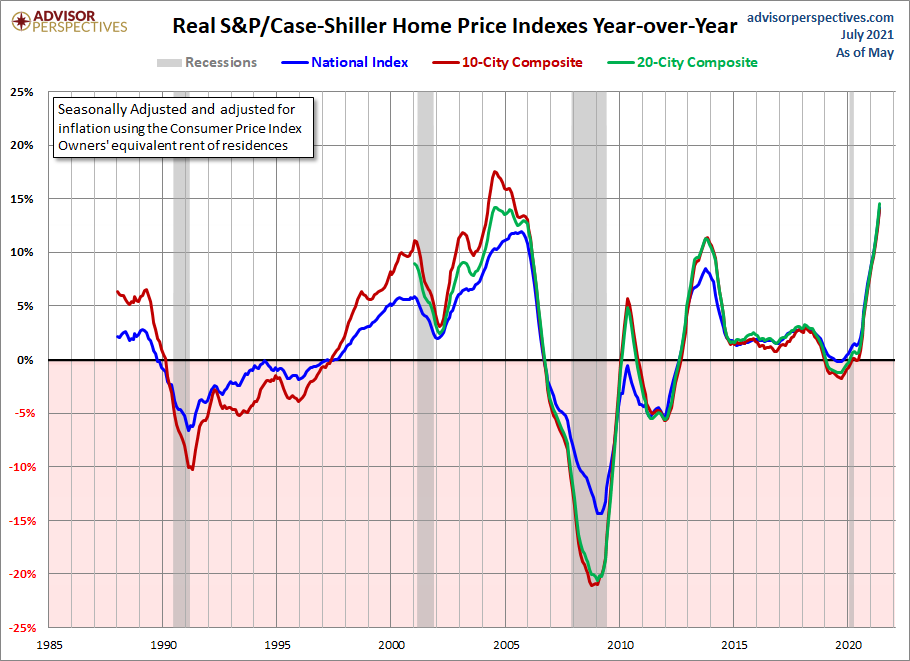
4. Of course, the main reason why I say this is the unhealthiest housing market post-2010 is that pricing has gone straight vertical in the existing home sales market, not because of a credit boom but because of a raw shortage of homes. This was my big fear.
5. The 5-year cumulative price growth model that I had for years 2020-2024, which I believed things would be okay if we just only had 23% price growth during this period, has been smashed before two years.
That gives a headline look at what we are dealing with currently.
HousingWire: To add on to that, where do you think people are going wrong the most when seeing the housing reports and interpreting the data themselves?
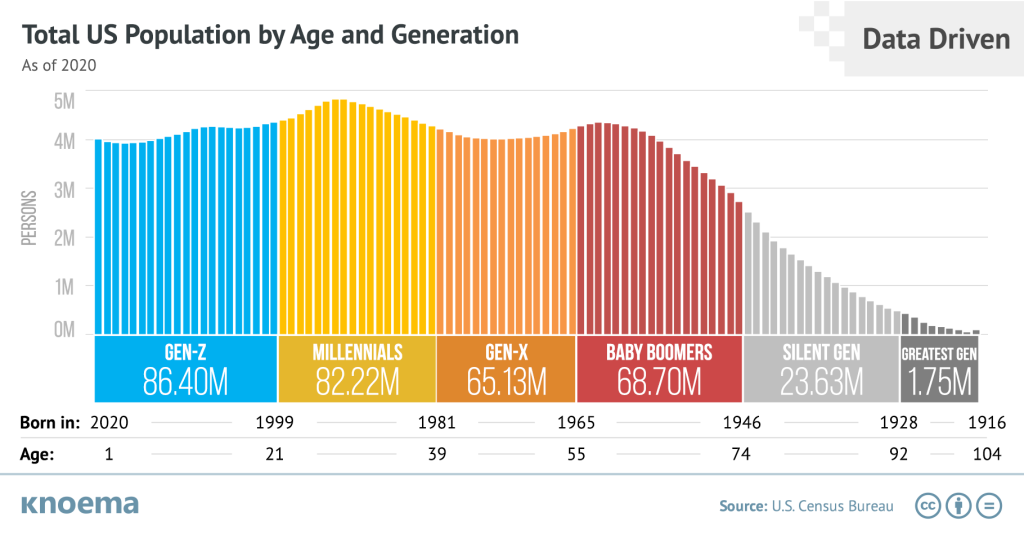
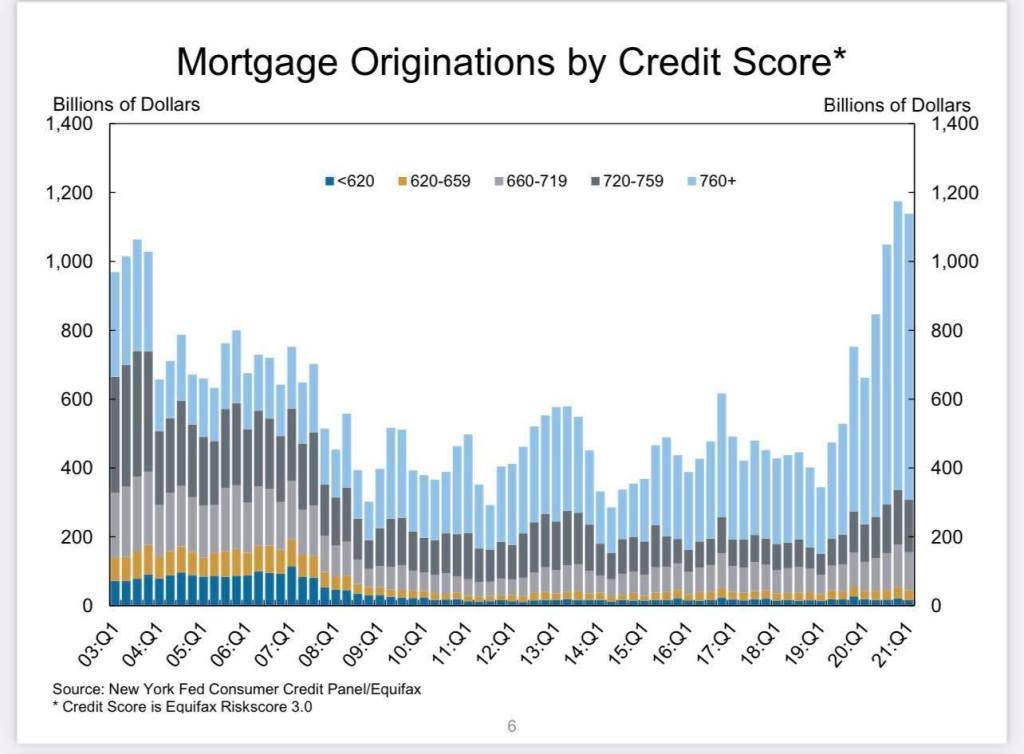
Logan Mohtashami: Professional grifters have plagued housing for many years who only wanted people to click their sites. Housing is driven by 2 things, primarily demographics and mortgage rates; both these things are at the best levels ever recorded in U.S. history during the years 2020-2024. When people look at housing, they look at price only, which leads to some terrible takes in the previous expansion, especially in 2020/2021. Number one thing I see wrong is that people assume that because prices are rising, we have a credit boom. We don’t have the market from 2002-2011 as we have had from 2014-2021. This is why I stress the term replacement buyers rather than a boom in demand. This gives a more realistic outlook on demand in America.
Mother Demographics is a potent economic force. People need shelter, and housing is the cost of shelter to your own capacity to own the debt, not an investment. I use this premise often to get people back in line with what really drives housing.
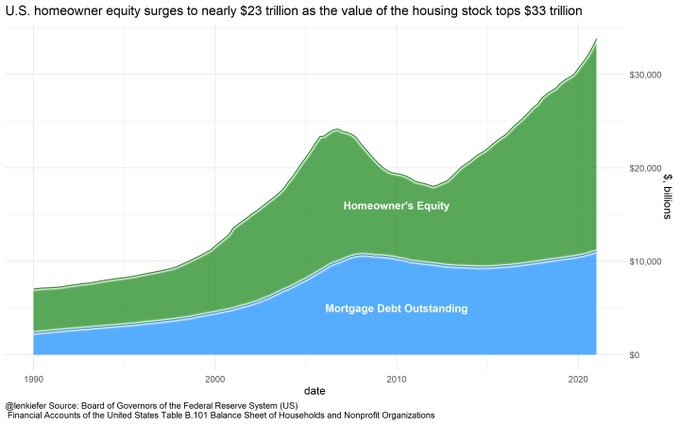
Also, and this is extremely important. American homeowners have never looked better on paper ever. The entire forbearance Crash Bro theme that I started for HousingWire last year was to show the American public that the people last year that we’re calling for a crash this year believe that demand can be stable. The velocity of inventory would skyrocket because Americans are in bad shape. It’s not the case; you can see these people lack economic training. The premise was that forbearance was going to fall as these homeowners were all in good shape, and once the jobs return, they will get off forbearance. We have seen a collapse in the data since last year.
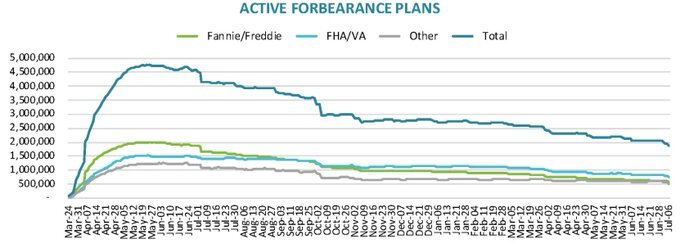
We have gone from nearly 5,000,000 forbearances to 1,860,000, and more and more Americans are getting off a forbearance. This has been a terrible 2 years for not only the American bears but the housing bubble boys, which on a record made one of the worst forecasts ever, that home prices have to go back to the start of the bubble in 2012, which now is 86% decline in one year. On a historical basis, this could be the worst forecast on record. Not only did housing lead us out of recession, but prices are also way too hot. This is what happens when untrained people are allowed to talk about economics.
Economics done right is terribly boring. Housing economics is not the sexiest sector when you break it down to core variables. However, you can’t get clicks that way.
HousingWire: How do you see the Delta variant impacting the housing market?
Logan Mohtashami: With the last two surges, in summer and the winter, the virus doesn’t impact the economic data in a big way anymore. My belief which I wrote about last year, is that we can’t replicate the fear of the virus — like we did in March of 2020. We are working from the longest economic and job expansion in history; Jan + Feb economic data was good.
Especially housing data. When I think back on this period 30 years from now, it will always be the Feb 2020 data which was the biggest data line. Housing broke out all over the place for the first time in 12 years. That was your clue right there that we were going to be fine. However, we got all that data in mid-March, and we were hoarding toilet paper then.
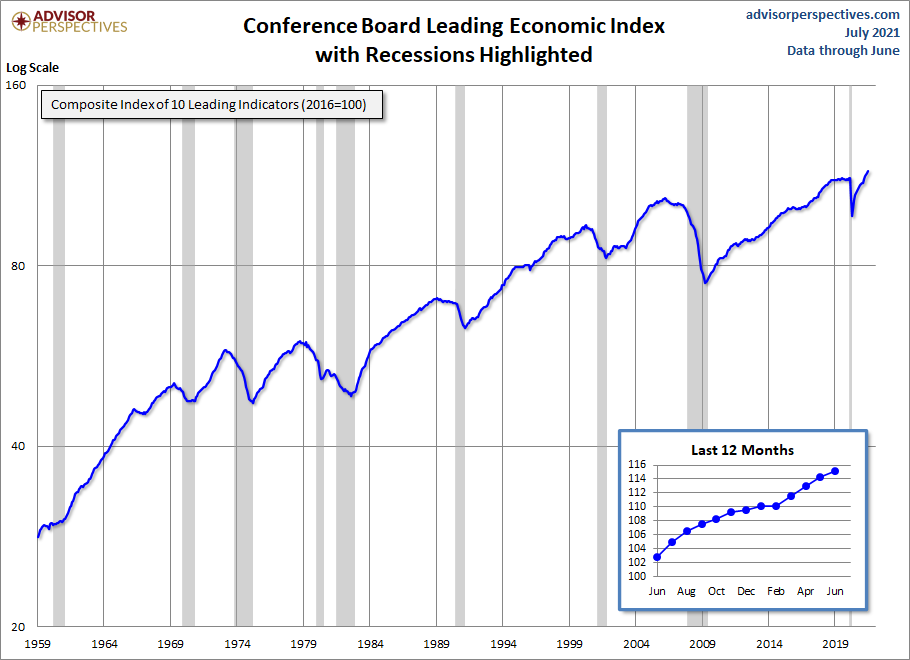
Americans don’t panic as they did in March/April, so everyone has learned to consume goods and services with an active virus killing people each day. Now that nearly 70% of the country has at least one shot, and we see the virus curve falling in other countries, people have learned to live with the virus. Even with the 2 surges last year, the Leading Economic Index still rose.
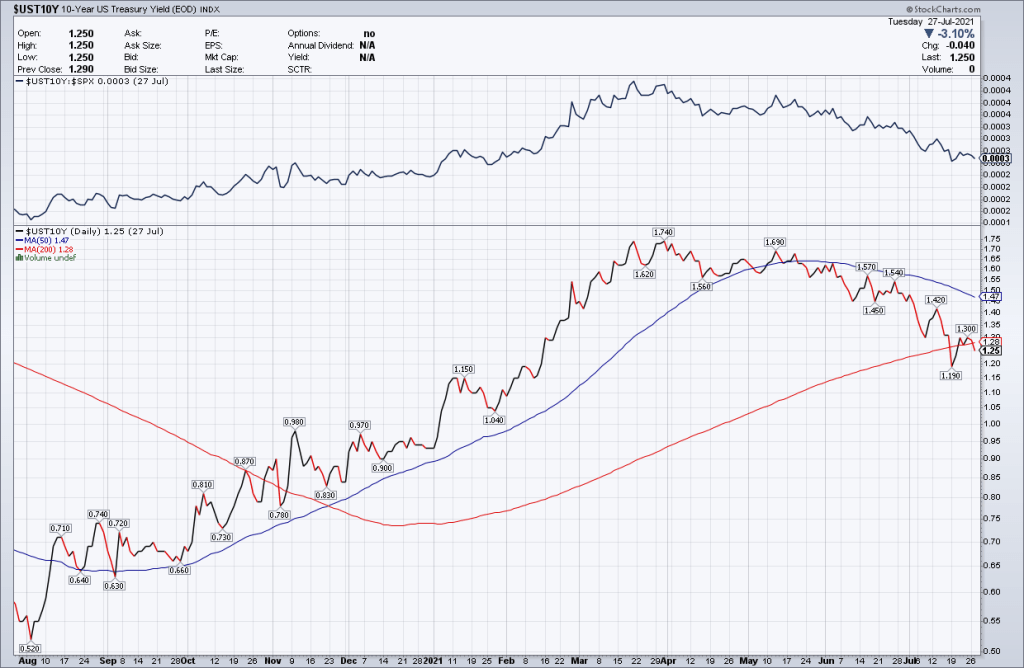
HW+ Member: Speaking of rates, you forecast that rates could get as low as 2.25% – 2.375%. Why do you foresee this? What would make them go up?
Logan Mohtashami: Yes, I am a big believer in bond market yield ranges for the year. Since 2015 when I did them for my own blog, I believed the bond market yield range should stick between 1.60% -3%. For 2021, the 10-year yield range forecast was 0.62% – 1.94% than means 2.25%-2.375% is in play; the higher end range is between 3.375% – 3.625%. We really only had 3.375% for maybe two days when yields got over 1.70%. If the stock market has an accurate correction this year, that can drive the 10-year yield below 1% easily, which is a valid reason for rates to go lower with the A.B. recovery model premise of needing a range of 1.33% -1.60% to be formed in 2021, the 10-year yield actually looks remarkably in line to me.
HW+ Member: Prices are clearly way up across the board, but do you think they are overstated? In our market (metro Wash DC) there has been a disproportionate increase in the number of high-end sales, and that fact alone has pushed both the median and average prices higher.
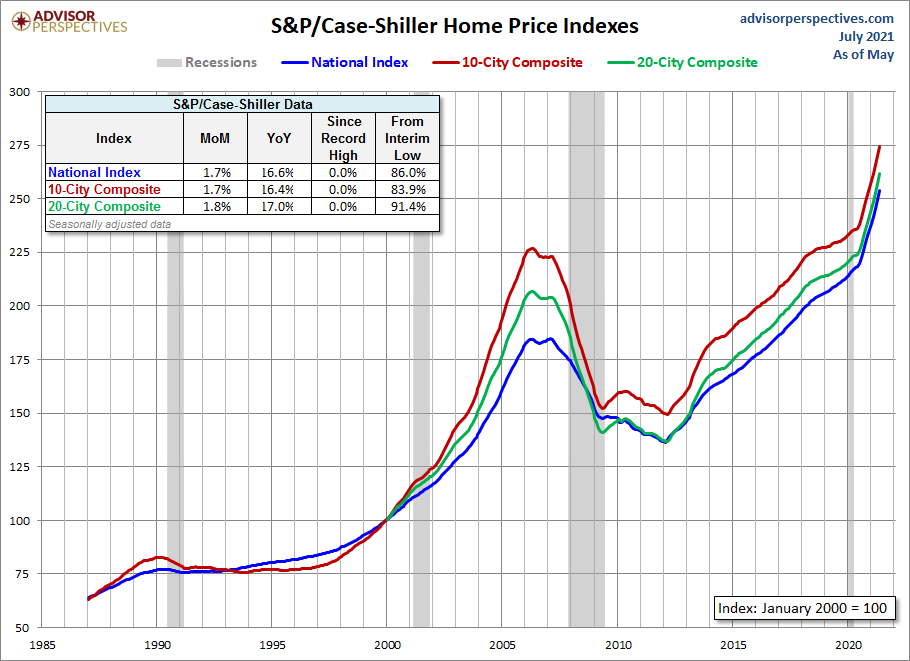
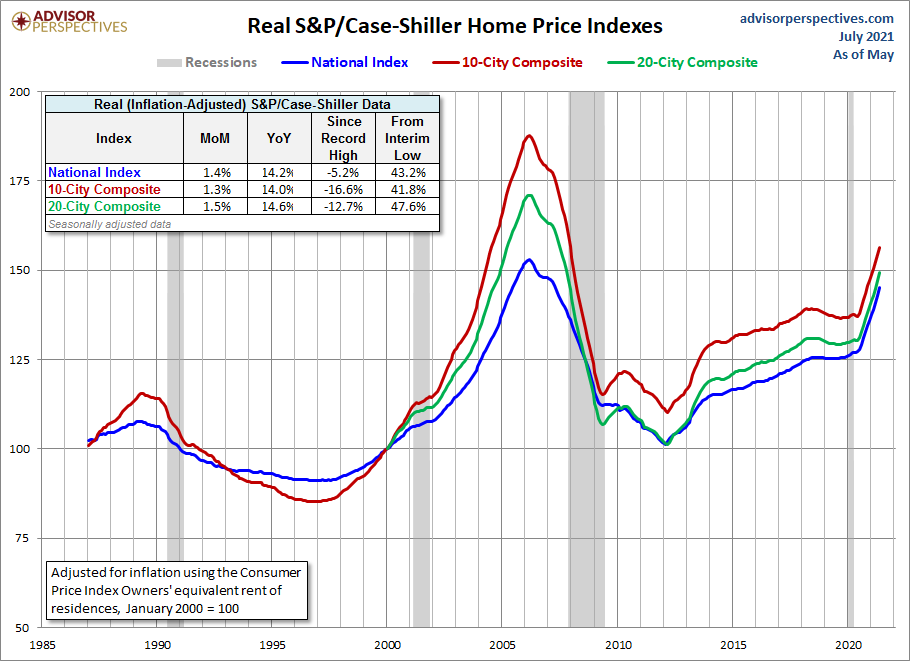
Logan Mohtashami: Home prices in all segments, low, mid and higher, are all rising together; I always like to use the Case Shiller (This lags a lot, by the way) real home price growth data on YoY prices. The upper-scale market has done extremely well, which has always impacted the median price data, but the upper price market is small compared to the general housing market all over the country.

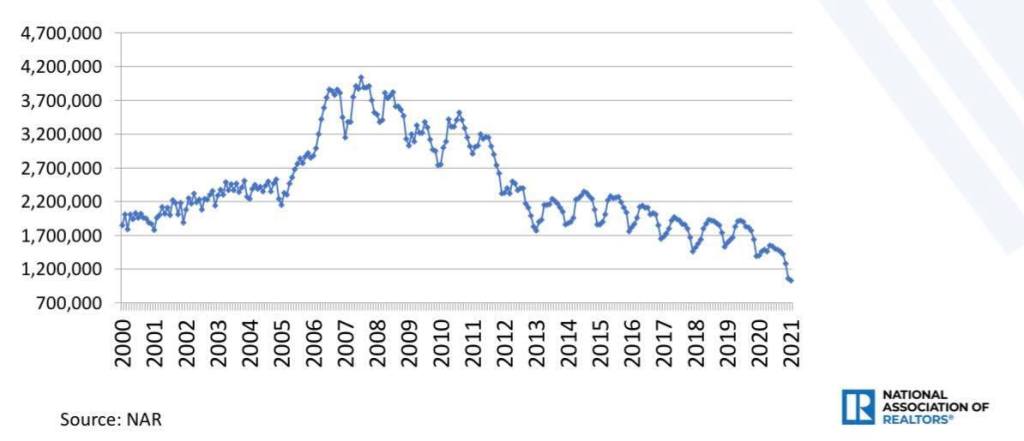
One thing about Inventory which is a key storyline for me. Total Inventory levels have been falling since 2014. Even with 5% mortgage rates, the inventory level channels didn’t budge much. So you can see my concern about the years 2020-2024; if you get even a slight demand increase, those levels can go lower.
People have to stay in their homes longer and longer. Americans households look great on paper as homeowners.
Fixed low debt cost vs. rising wages.
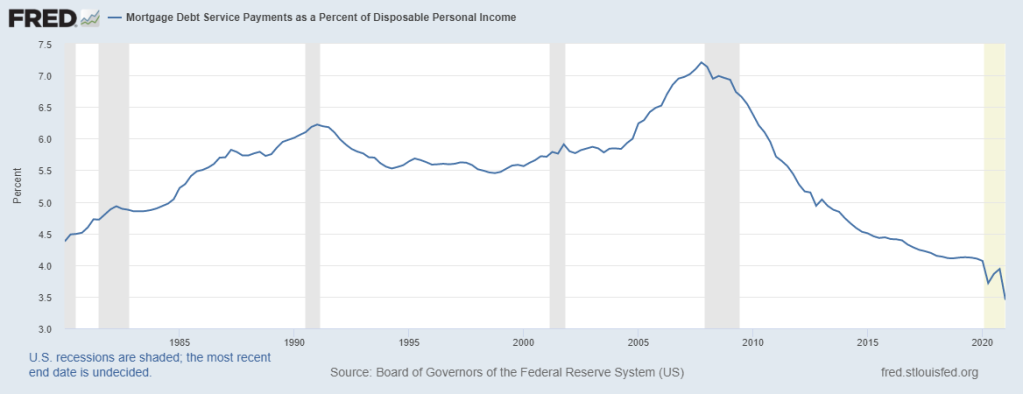
Cash flow, is excellent, it was awesome in the previous expansion and got even better in 2020/2021.
Then on top of all that, the nested equity position is the best…………….”The Human History.”
HousingWire: To that point, do you have a timeline for supply getting over 6.5 months? What factors will get us to that point?
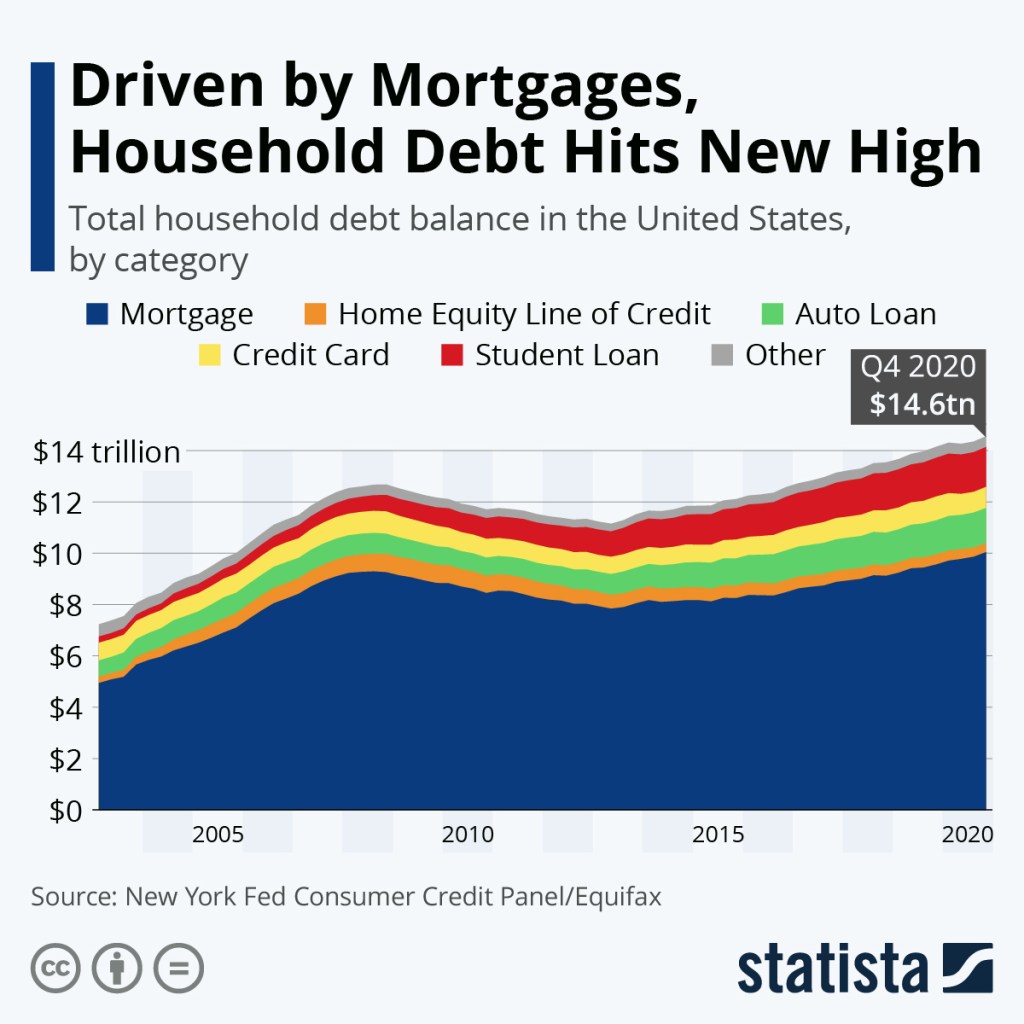
Logan Mohtashami: Since Mortgage Debt adjusting to inflation isn’t even positive from the housing bubble peak, we weren’t working from any overheating demand cycle. The quality just got better and better each year post-2010. Note: The most important thing now is that post-2010, we have no exotic loan debt structures in housing, recast risk in a down-trending price market is ZERO.
Remember that the new home sales market is much different from the existing home market. These markets are like other planets. Rule of thumb for the new home sales market for me always. This has always been the most important housing data line I use because new home sales mean more to GDP than the existing home sales marketplace.4.3 months and below, life is great for the builders; they can do whatever they want.
This never happened really in the previous expansion from 2008-2019. However, in 2020/2021, that was the case, 4.4- 6.4 months, life is ok; housing starts can grow as long as new home sales can grow. However, the builders are mindful, this was the case in the previous expansion 6.5 months, and above, bad, builders will pull back. Now we got over 6.5 months in 2018 when rates got 5%, one month Covid19. Currently, the headline supply is 6.1 months; we can get to over 6.5 months in the following report. However, you always want to use a three-month average.
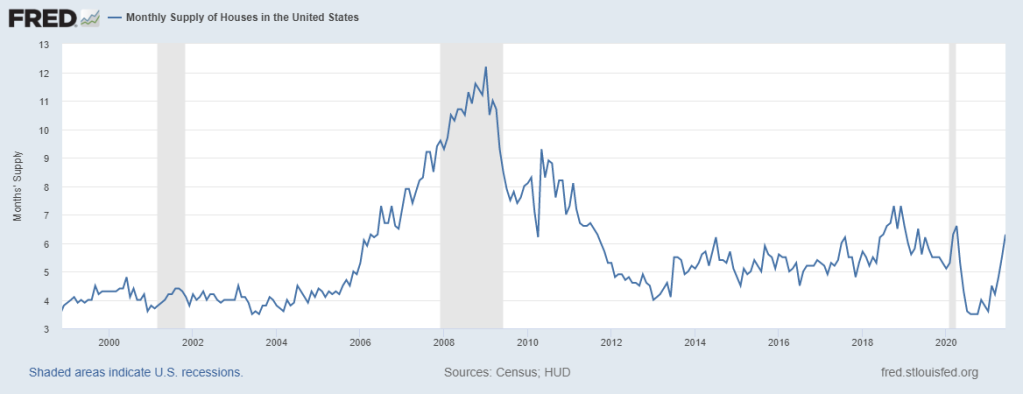
This is 5.53 months currently; the builders are really mindful of their markets now and want to get a better sense of the demand.
HW+ Member: How do you see the end of this shrinking forbearance cycle playing out, with all of these above variables running so strong?
Logan Mohtashami: On forbearance, I believe people think that all 1.86 million homes will flood the market on some date. It doesn’t, nor has it ever worked that way. People have their forbearance start date on different months. It looks like the people who are on the borderline of keeping their homes might have access to a 40-year mortgage to make their payments easier. However, real estate investors, especially mom and pop investors, who got into trouble due to COVID-19, those to me are going to be net sellers faster
It’s one of the variables I add in this article. Inventory has been rising for months now!
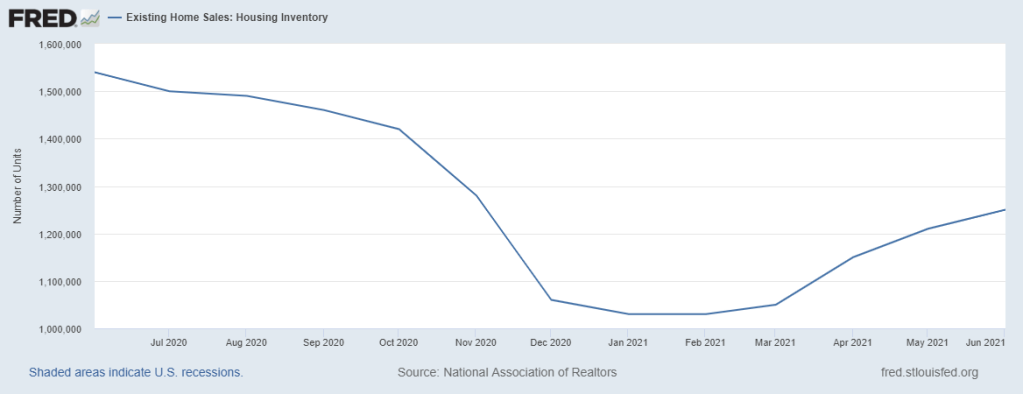
But this is the seasonal push we get each year, soon seasonality will kick in for Fall and Winter, and we start it again next year. We want inventory levels to get off these low levels and go higher. However, we want it to stick higher, so we get fewer bidding wars.
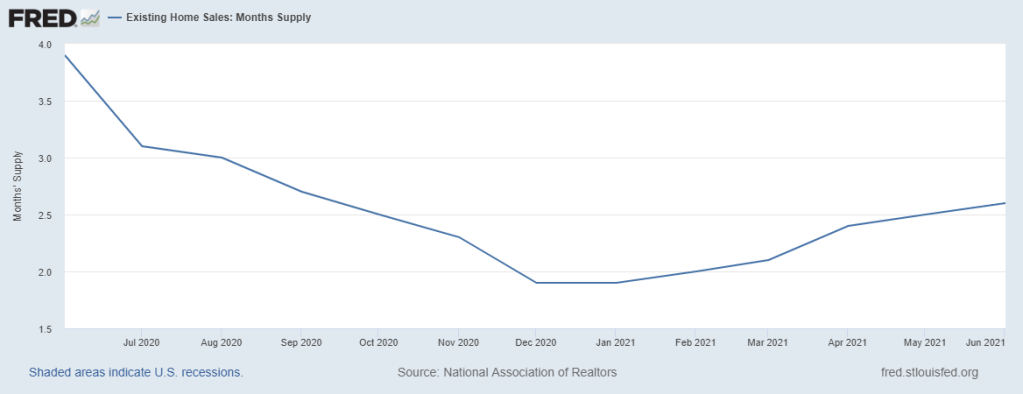
As long as the days on the market are this low, I will always say this is the unhealthiest housing market post-2010. Very aggressive pricing with little sales growth is not what you want to see.
HousingWire: To wrap up the Q&A, you said that the existing home sales market has moderated but not as much as you thought it would have. Do you think it will hit your expectations by the end of the year? What is the impact to the housing market if it doesn’t?
Logan Mohtashami: Back in March, I had talked about how Pending Home Sales look right to me and that I am expecting some existing home sales print under 5,840,000. So far, we have only gotten one report under that level. Every print so far this year has been higher than the 2020 total existing-home sales ending print of 5,640,000. It looks like we will get higher sales growth this year but not by much. I am still expecting to see some more sales under 5,840,000. However, it hasn’t happened yet. A lot of this is the function of the moderation in the data has housing had over a 1 million sales gap trend from where we closed in 2020 then tends to revert to trend.
Take full advantage of your HW+ membership and join our exclusive Circle platform dedicated only to HW+ Members! To join the community, go here.

