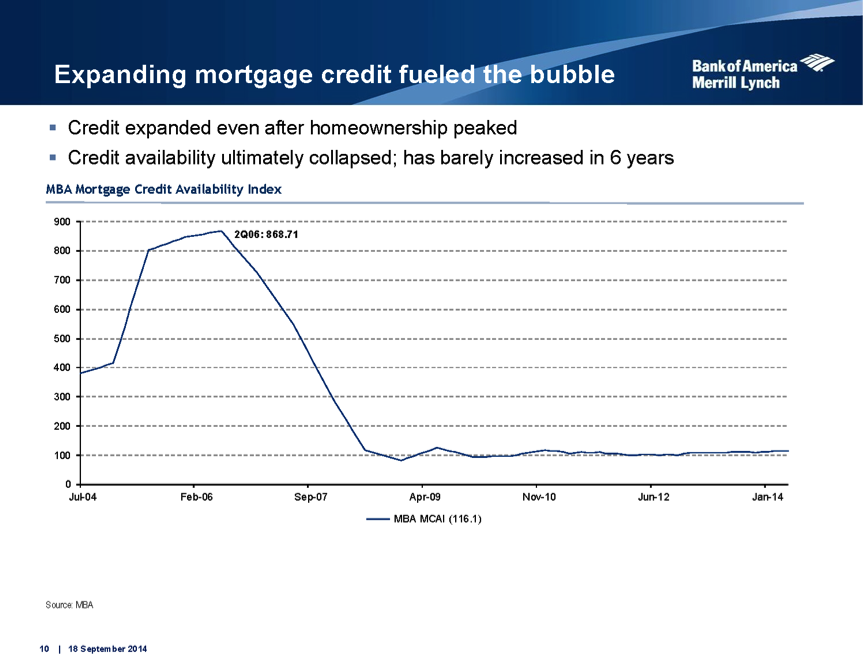
For all the talk of expanding the credit box and opening up credit to previously underserved borrowers, there have been no significant fluctuations or improvements to mortgage credit availability since 2009, according to a new report from Bank of America Merrill Lynch (BAC).
In this week’s Securitization Weekly Overview, BofAML’s Chris Flanagan, Gregory Fitter and Mao Ding said that there has been little improvement there has been to mortgage credit availability in the last five years.
And the analysts write that the lack of available mortgage credit is holding down the economic recovery.
“We think tight mortgage credit and weak demand for mortgage credit are key driving forces behind the slow growth recovery story and the positive technical story for securitized products,” the analysts said.
“In turn, we think this mortgage production weakness will keep long-term interest rates biased lower and help drive the yield curve flattening process that started at the beginning of 2014 and should persist until the end of 2016.”
The analysts also predict that the "historically depressed" levels of mortgage production aren't going to improve for the next several years.
Just how bad has it been, click on the chart below, which shows the Mortgage Bankers Association’s Mortgage Credit Availability Index over the last ten years.
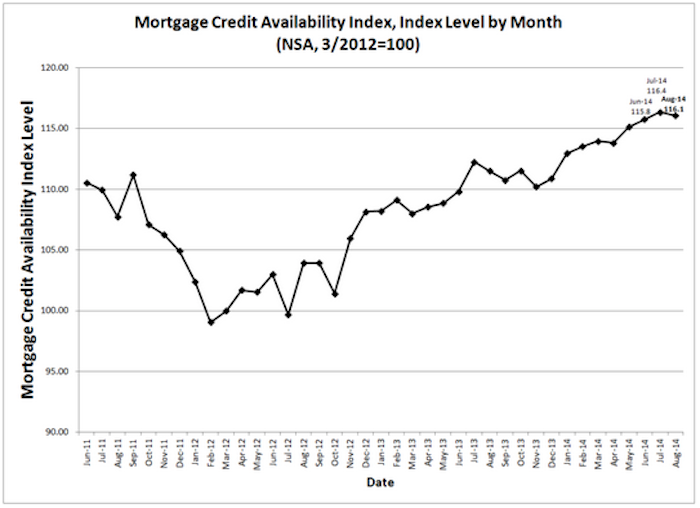
There have been moderate increases in mortgage credit availability in the last several years, as evidenced by the chart below from the MBA, but it still isn’t even scratching the surface of where things were in 2008, when the MCAI peaked at 868.71.
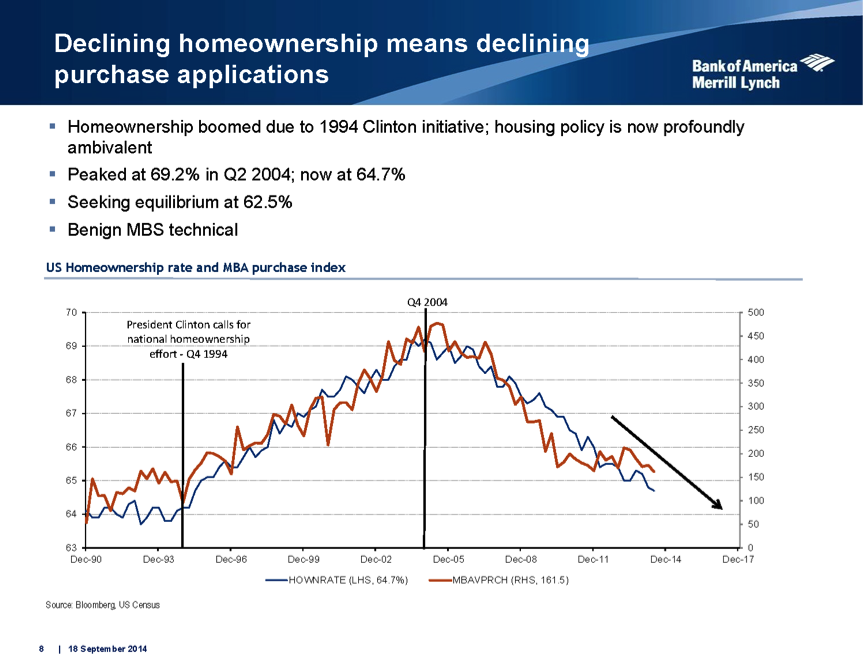
Additionally, tight credit and other repercussions of the housing crash are driving down homeownership without any signs that the trend will reverse.
Click the chart below to see the declining rate of homeownership since 2004.


