


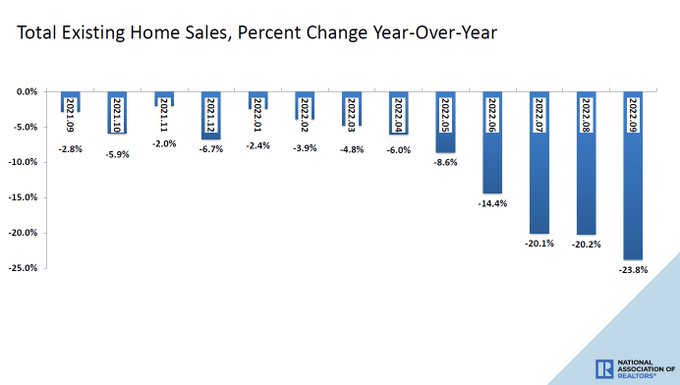
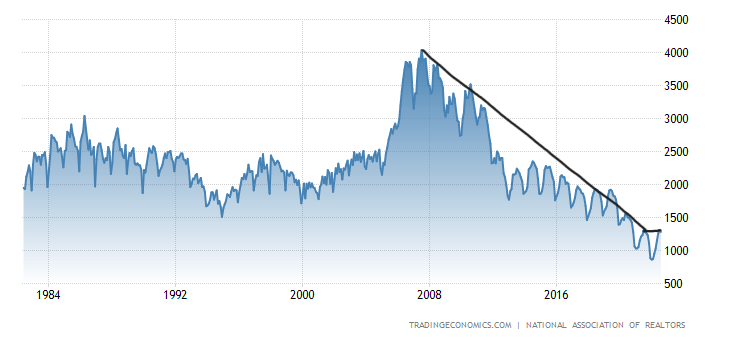
On Thursday the National Association of Realtors reported that we had a 23.8% year-over-year decline in existing home sales in September and total inventory has now fallen on back-to-back reports.
Earlier in the year, I labeled this a savagely unhealthy housing market based on the premise that inventory would break to all-time lows, creating forced bidding and causing days on the market to collapse. This is not a good thing. With this report, finally, we are now seeing some positive data on this.
While still too low for my taste, the days on the market are heading in the right direction —higher — creating balance. With such massive home-price growth in 2020 and 2021 breaking my affordability model, I knew we were at high risk of a more significant sales decline than usual if the 10-year yield broke over 1.94%, which meant 4% + mortgage rates.
My premise in the summer of 2020 was that a 10-year yield above 1.94% could change the housing market. The second working premise was that if home prices grew more than 23% in five years, we would be in trouble as well. Well, that got smashed in just two years, and 2022 is another year on the books with significant price gains. Both variables in my model started to dance together in April this year, resulting in our current marketplace.
The role of mortgage rates
Not only did mortgage rates break above 4%, we are now over 7%. Sales are declining faster than we have seen in the past when rates rose, reeling from the epic one-two punch of the affordability hit from massive price gains since 2020, along with an explosive mortgage rate run-up. Rates have gone up so fast that new listing data has declined since the end of June; this impacts supply and demand.
It was a savagely unhealthy housing market back in February, and it has just gotten worse and worse.
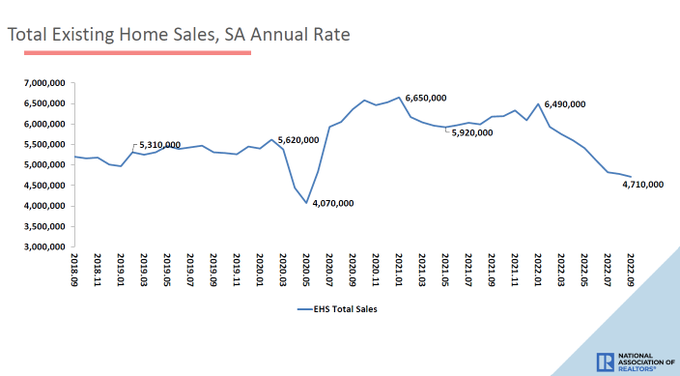
From NAR: Total existing-home sales, completed transactions that include single-family homes, townhomes, condominiums, and co-ops, retracted 1.5% from August to a seasonally adjusted annual rate of 4.71 million in September. Year-over-year, sales waned by 23.8% (down from 6.18 million in September 2021).
With nearly 65% of American households having a mortgage rate between 2%-4% and 85.9% having rates of 5% and below, you can see why some sellers are hesitant to list their homes and move. The total cost of housing has gone up so fast that it has changed behavior, and new listing data has declined since June.
This is why I consider this housing market sloppy and why mortgage rates moving up so fast is problematic. It would be one thing if rates had moved to 4.75%-5.75%, and we stayed in that range. However, going from 2.5% to 7.37% today is too fast for some. I am hoping for a more traditional listing season in the Spring of 2023: The last thing we want to see for the spring of 2023 is new listing data going negative year over year.
From NAR: Total existing-home sales retracted 1.5% from August to a seasonally adjusted annual rate of 4.71 million in September.
As I have talked about often during this year, once the demand data started to get worse, we were in a place where we would see more significant year-over-year declines in the demand data starting in October of this year. This is because last year at this time, mortgage demand started to pick up, so the weekly index will show this first.
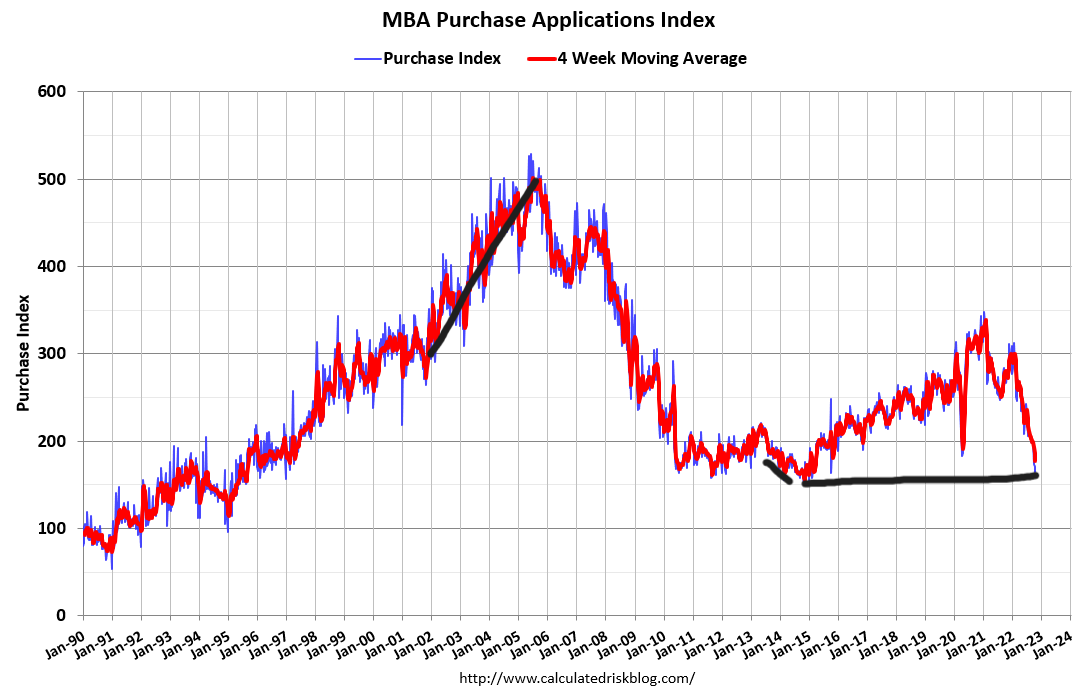
Purchase App Data Update:
-4% week to week
-38% year over year
-36.25% four-week moving average
As we have discussed for some time, the comps have gotten more challenging now that we’re in October, so expect 35%-45% YoY declines to be the norm as demand picked up last year. If more weakness happens, -53%-57% year-over-year declines are in play due to the more challenging comps from October to the end of December.
We rarely have non-seasonality growth in this data line, but it did happen last year with mortgage demand, which led sales to 6.49 million.
With that in mind, we should see significant declines year over year in the existing home sales data going out to January of 2023.
NAR: Year-over-year, sales waned by 23.8% (down from 6.18 million in September 2021).
Now that we are getting closer to the end of this year, I believe my price-growth forecast for 2022 will not be correct, as I was looking for a more significant deceleration in price growth. I was looking for the year to end between 5.2% and 6.7%, and it seems we will end the year higher than this. One thing I can say for sure is that 4%-5% mortgage rates didn’t do the damage I thought they would do, but once rates got to 6%, they did.
This goes into my long-term work on housing going back to 2013, when I talked about many of my affordability models getting hit much harder if mortgage rates get above 5.875%, and we are in that stage now.
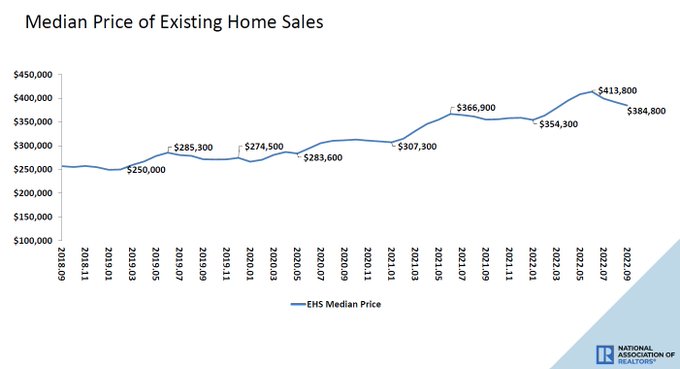
NAR_Research: The median existing-home price for all housing types in September was $384,800, an 8.4% jump from September 2021 ($355,100), as prices climbed in all regions. This marks 127 consecutive months of year-over-year increases, the longest-running streak on record.
The silver lining
Now on to the positive story: the days on market growth are almost above a teenager print, which hasn’t happened in a while. Having a lot of house options is always a plus for the housing market, and what we’ve had since 2020 was nothing close to balance. I prefer a housing market with 2019 total inventory levels, and we aren’t there yet.
Inventory has fallen in back-to-back reports toward 1.25 million. Once we reach a range of 1.52-1.93 million, my low inventory talk goes away, and the savagely unhealthy housing market ends. For 2023, we can get back to these levels as long as we have traditional listing growth with higher rates. If rates fall back down and demand picks up next year, it will get more challenging.
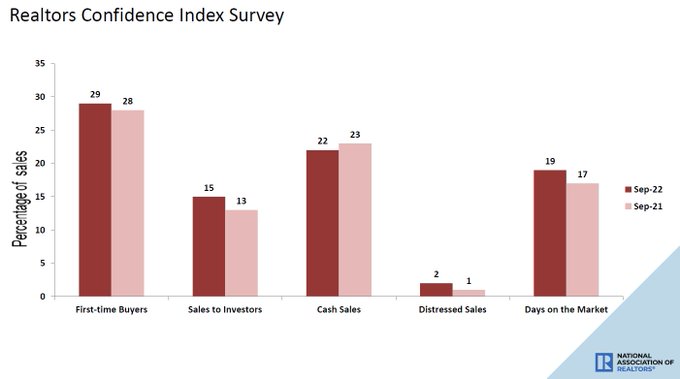
The days on the market of 19 days brings nothing but a smile to my face as we try to get the housing market back to normal. Normal for me is 30 days plus. More choices are good; in my opinion, the best way to fight inflation is with more supply. We got into a historically bad area with supply post-2020 and are working our way back to normal.
NAR Research: First-time buyers were responsible for 29% of sales in August; Individual investors purchased 15% of homes; All-cash sales accounted for 22% of transactions; Distressed sales represented 2% of sales; Properties typically remained on the market for 19 days.
As we can see, for months the housing sector has been in a recession as demand, production, jobs, and incomes are falling. The affordability hit the industry took in 2022 is a historical event. We are coming toward the end of the Fed rate hike cycle unless the labor market gets stronger and stronger.
At some point in the future, when the growth rate of inflation is falling, and the economic data does get softer, mortgage rates should fall. Until then, we can see that the American homeowner is in much better shape than many people imagined. When rates fall, the country will have more supply to work from, and home sellers who are homebuyers will feel more comfortable listing and buying that next home.
Also, please keep your fingers crossed, the days on the market will get above 30 days and we get back to normal.


