


The housing inventory data from last week makes me wonder if we are starting the seasonal decline in active listings in August. Mortgage rates also had a crazy week and purchase apps fell once again.
- Weekly active listings rose by only 2,939
- Mortgage rates went from 7.04% to 7.20% and back to 7.03%
- Purchase apps were down 3% from week to week
Weekly housing inventory
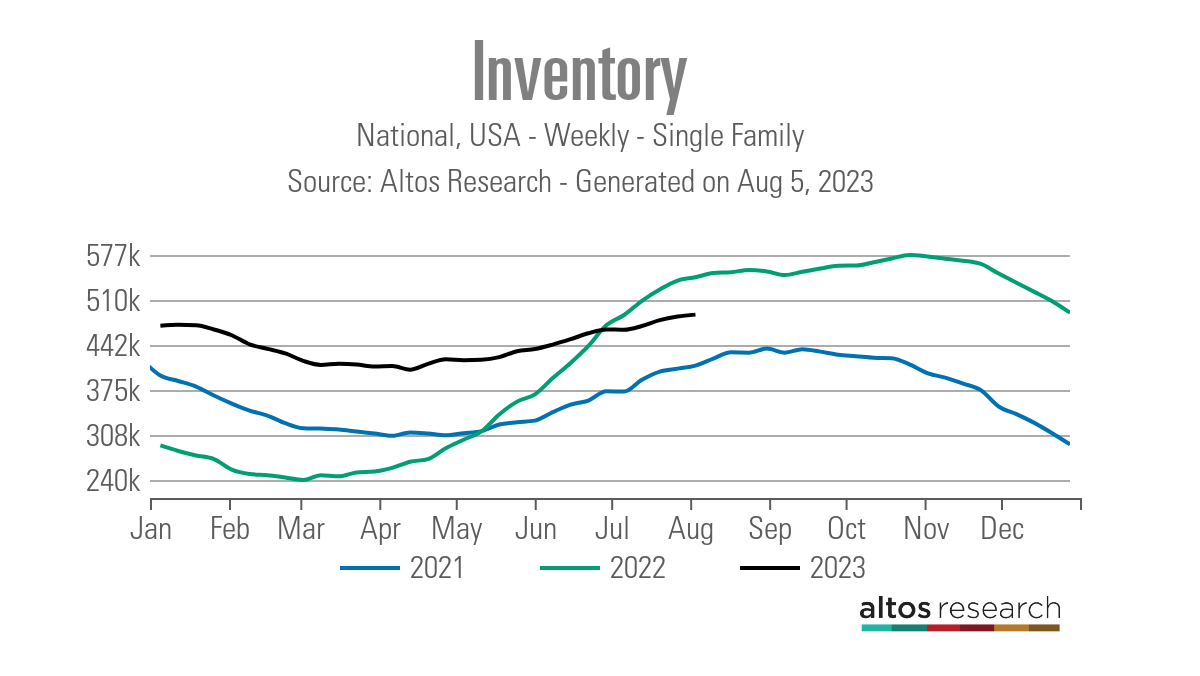
Traditionally, we would see a seasonal decline of active listings for single-family homes going into the fall, but seeing less than 3,000 homes added to the active listings data last week makes me wonder if we are going to see that decline early this year.
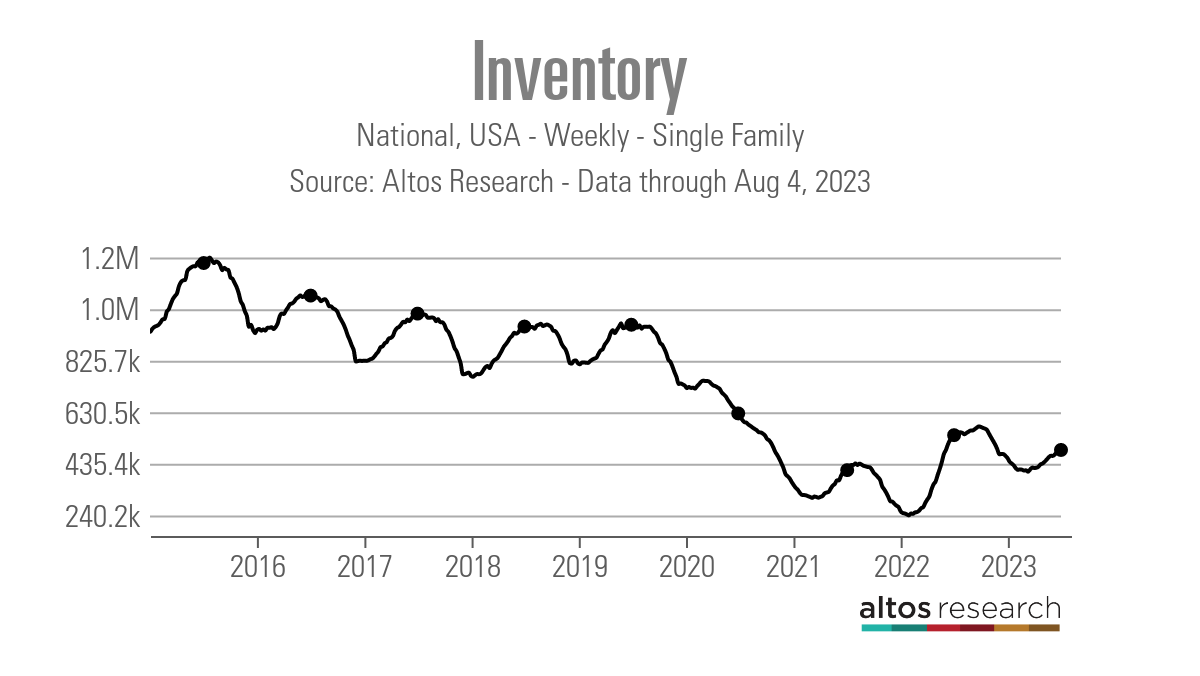
Saying that the housing inventory growth in 2023 has been disappointing is an understatement. It took the longest time in history to find the seasonal bottom, which happened on April 14. We usually see this in January or maybe February. Then the growth rate was so slow that we had weeks of negative year-over-year inventory data. Last week was another slow week of active listings.
- Weekly inventory change (July 28-August 4): Inventory rose from 484,599 to 487,870
- Same week last year (July 29-August 5): Inventory rose from 538,908 to 543,898
- The inventory bottom for 2022 was 240,194
- The inventory peak for 2023 so far is 487,870
- For context, active listings for this week in 2015 were 1,195,634
As we can see in the chart below, active listings have been negative year over year for some time now. Demand isn’t booming for the existing home sales market, but it’s not crashing like it did in 2022. Last week, I talked about the stable, not booming, housing demand on CNBC. That stabilization in demand has slowed inventory growth down this year.
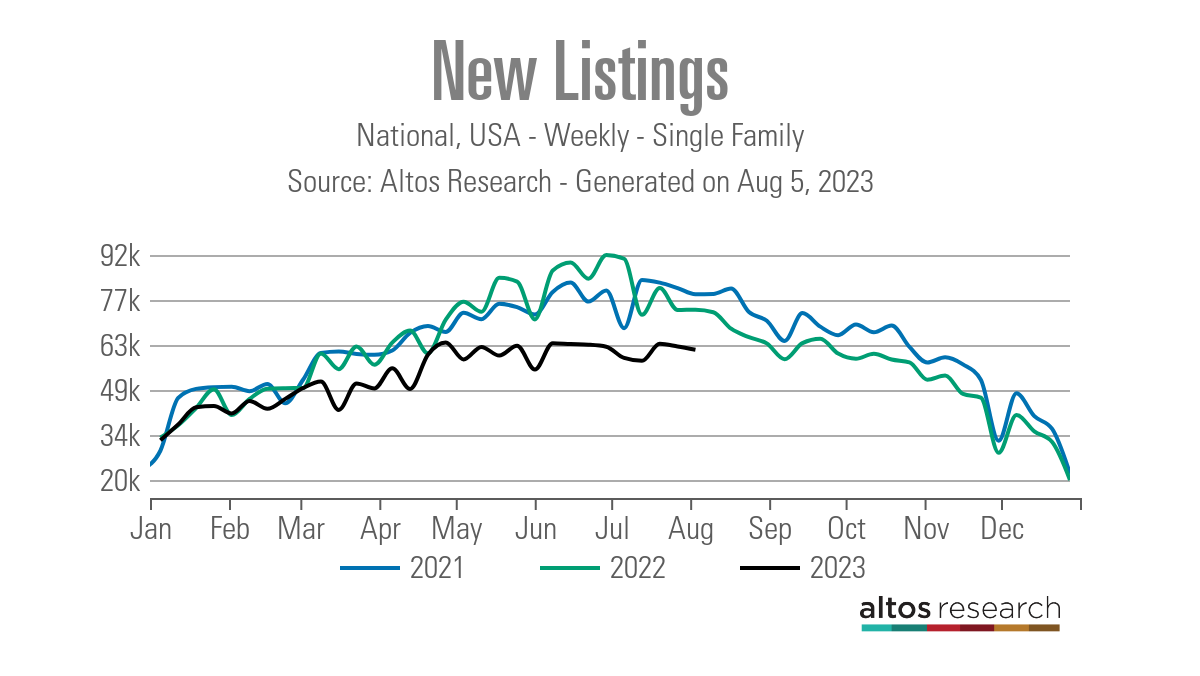
New listing data has been trending at the lowest levels recorded in history for the last 12 months. However, on a positive note, we haven’t seen another new leg lower, meaning that if this trend continues, we should see some flat to higher year-over-year numbers this year. As we can see in the chart below, new listing data is very seasonal and running into its seasonal decline period now. However, the decline is orderly, unlike last year.
Here’s how new listings this week compare to the same week in past years:
- 2023: 61,490
- 2022: 74,195
- 2021: 79,106
Mortgage rates and bond yields
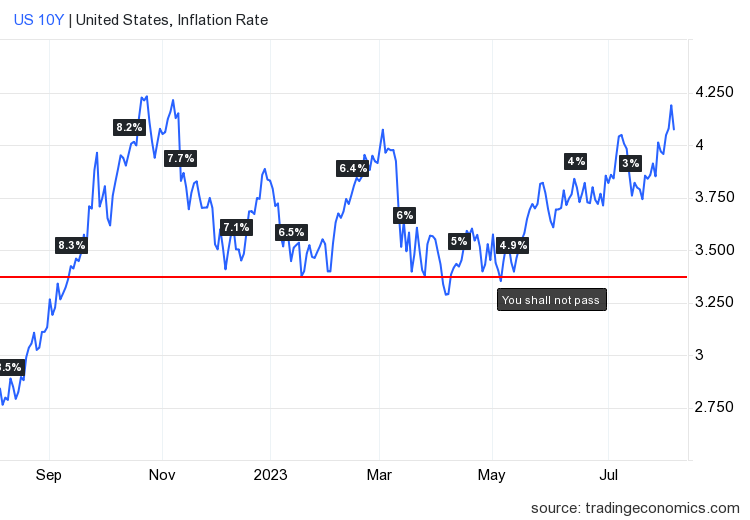
Last week was wild for the 10-year yield and mortgage rates as we came close to testing my peak 10-year yield call of 4.25%, hitting 4.20% on jobs Friday, only to fall back toward 4.04%. Mortgage rates started the day at 7.20% and ended the day at 7.03%. We need the 10-year yield to stay below 4% to see mortgage rates drop below 7%, into the 6%-6.875% range.
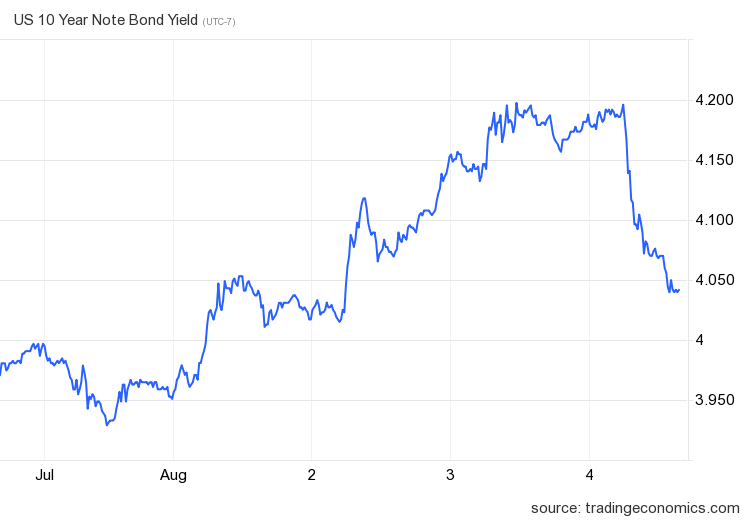
My 2023 forecast range for the 10-year yield was 3.21%-4.25%, meaning mortgage rates between 5.75%-7.25%. Rates got worse after the banking crisis but are behaving better lately; hopefully, this trend will improve with time. As we can see in the chart below, the forecast range has stuck for 100% of the year.
Purchase application data
Purchase application data was down again by 3% last week, making the count year-to-date at 14 positive and 15 negative prints. If we start from Nov. 9, 2022, it’s been 21 positive prints versus 15 negative prints. Mortgage rates near or above 7% are making it difficult to get any traction on the demand side of housing. The best data we had here recently was from Nov. 9 until the first week of February, giving us three months of positive data. However, after that, it’s been a flat year with apps.

The week ahead: Inflation week is here!
It’s Inflation week, so get ready for two key reports: the Consumer Price Index on Thursday and the Producer Price Index on Friday. It is key for the housing market and the economy that core inflation continues to see lower growth. The Federal Reserve is very focused on core inflation, not headline inflation, so that’s what I will be focusing on with the two inflation reports. And of course, every Thursday we also have the jobless claims report to be mindful of.


