Home prices continue to hit new highs with the latest increase in May, a slowdown from April’s increase but still up month-over-month, according to the House Price Index released by the Federal Housing Finance Agency.
Home prices increased 0.4% monthly in May, according to the seasonally adjusted monthly House Price Index. This is down from the downwardly revised increase of 0.6% in April. Year-over-year, home prices increased 6.9%.
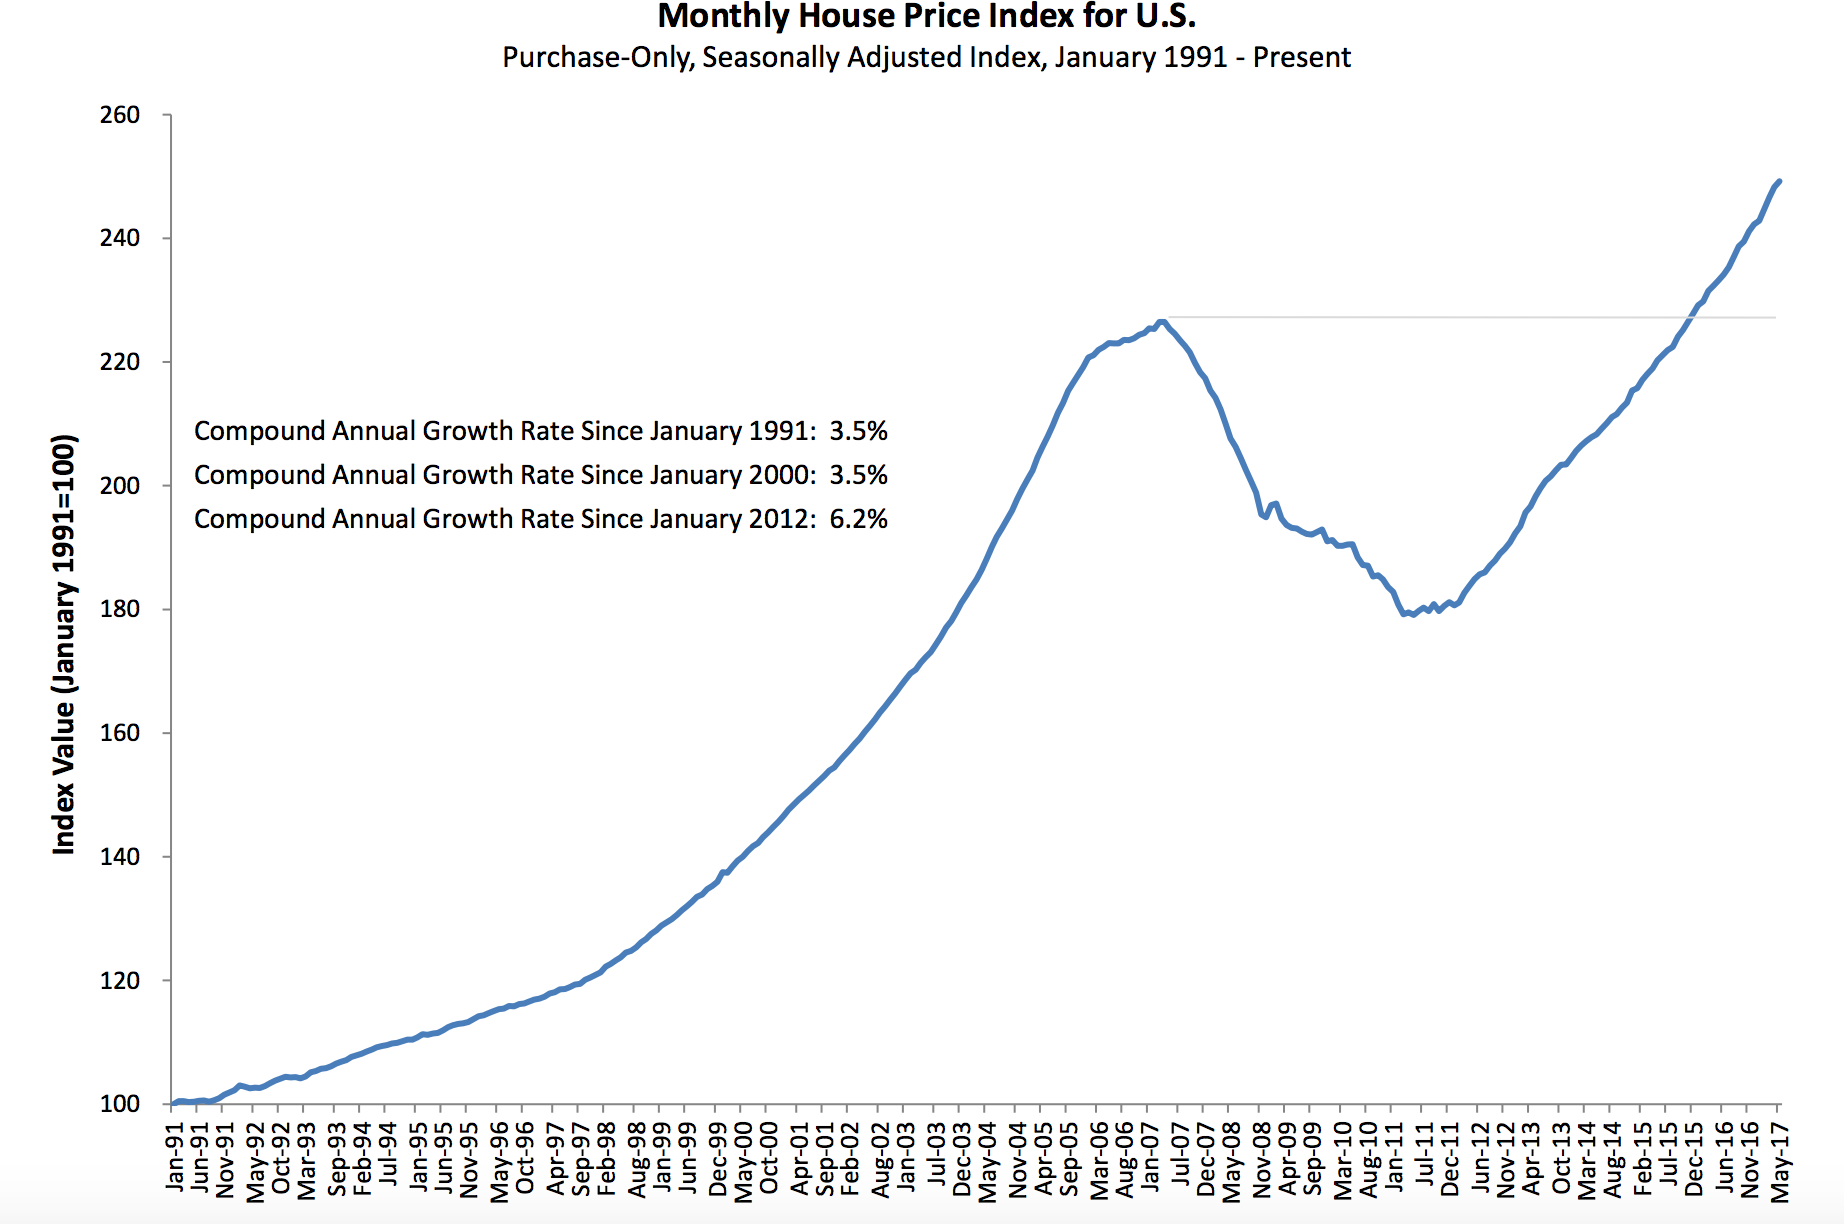
The chart below shows home prices surpassed their previous 2012 peak in early-2016, and continued to increase, consistently hitting a new peak.
Click to Enlarge
(Source: FHFA)
The FHFA monthly HPI is calculated using home sales price information from mortgages sold to, or guaranteed by, Fannie Mae and Freddie Mac. Because of this, the selection excludes high-end homes bought with jumbo loans or cash sales.
Other measures also show increasing home prices. The latest Case-Shiller report, released Tuesday morning, also showed a home price increase of 0.2% after seasonal adjustment. However, despite these increases, S&P Dow Jones Indices’ managing director explained housing is not repeating the bubble period. Here’s why.
Regionally, home price changes from April to May ranged from a drop of 0.5% in the Middle Atlantic division to a 1% increase in the West South Central division. Annually, all changes were positive, ranging from an increase of 4% in the Middle Atlantic division to an increase of 8.7% in the Pacific division.
Here is a list of which states are in each of those divisions:
Middle Atlantic: New York, New Jersey, Pennsylvania
West South Central: Oklahoma, Arkansas, Texas, Louisiana
Pacific: Hawaii, Alaska, Washington, Oregon, California