


Why are mortgage rates rising? This is a question many people are asking — even some of the Federal Reserve members.
We have had back-to-back weeks of the bond market getting wild since the key 10-year yield level of 4.34% broke higher. It didn’t help that the Fed was hawkish after the Fed meeting, as their forward outlook surprised some market players.
Jobless claims data has also improved in the last few weeks. The jobless claims data is my key 2023 economic data line for the bond market and mortgage rates because I don’t believe the Fed will pivot until the four-week moving average of jobless claims gets above 323,000. We are currently at 211,000; this is a shallow level historically.

This statement from the Fed is classic Fed at work.
The Fed has not helped its own cause here, as Austan Goolsbee, president and CEO of the Federal Reserve Bank of Chicago, said in a speech last week: “I’m still trying to process why long-end interest rates are increasing.”
My answer: “Stop talking about raising rate at this stage with a hawkish outlook!”
The Fed has expressed that real yields, meaning where inflation is currently and where rates are, are restrictive to the economy, so sounding hawkish on monetary policy at this stage can lead the bond market to go higher more than the Fed would like. Land the plane, folks, land the plane!
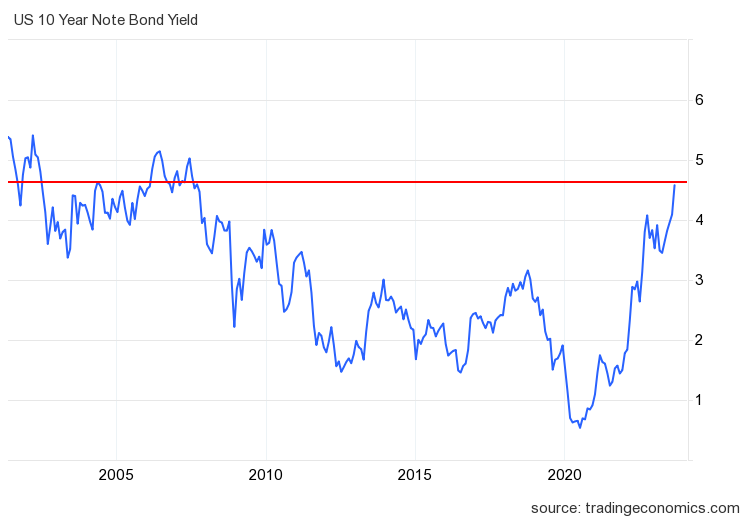
As you can see in the chart below, it was another wild week in the bond market. Mortgage rates went from 7.39% to a high of 7.65% and ended the week at 7.44%. Before last week the high for mortgage rates this year was 7.49%.
The bond market has been volatile, but after the 10-year yield broke the 4.34% level, I am watching for the 4.63% level. A close above that and follow-through bond market selling could lead to higher mortgage rates. Hopefully, the last two weeks caught the Fed’s attention. If they cared about a soft landing, which I have been skeptical about from the start, as I talked about here on CNBC, the Fed would be more mindful of what they say and do.

Weekly housing inventory data
One of the things I got wrong this year is that I believed if mortgage rates stayed higher for longer, active inventory would grow between 11,000 and 17,000 for at least some of the weeks; that hasn’t happened recently with higher rates — close but no cigar. T
Last week, the growth of active listings slowed to 6,808. Seasonality is kicking in now, but we should be able to continue growing housing inventory like we did last year, as higher rates slow sales down, keeping homes on the market longer.
Last year, the seasonal peak was Oct. 28. Last week, according to Altos Research:
- Weekly inventory change (Sept.22-29): Inventory rose from 527,938 to 534,746
- Same week last year (Sept. 23-30): Inventory rose from 556,865 to 561,229
- The inventory bottom for 2022 was 240,194
- The inventory peak for 2023 so far is 534,746
- For context, active listings for this week in 2015 were 1,187,2000

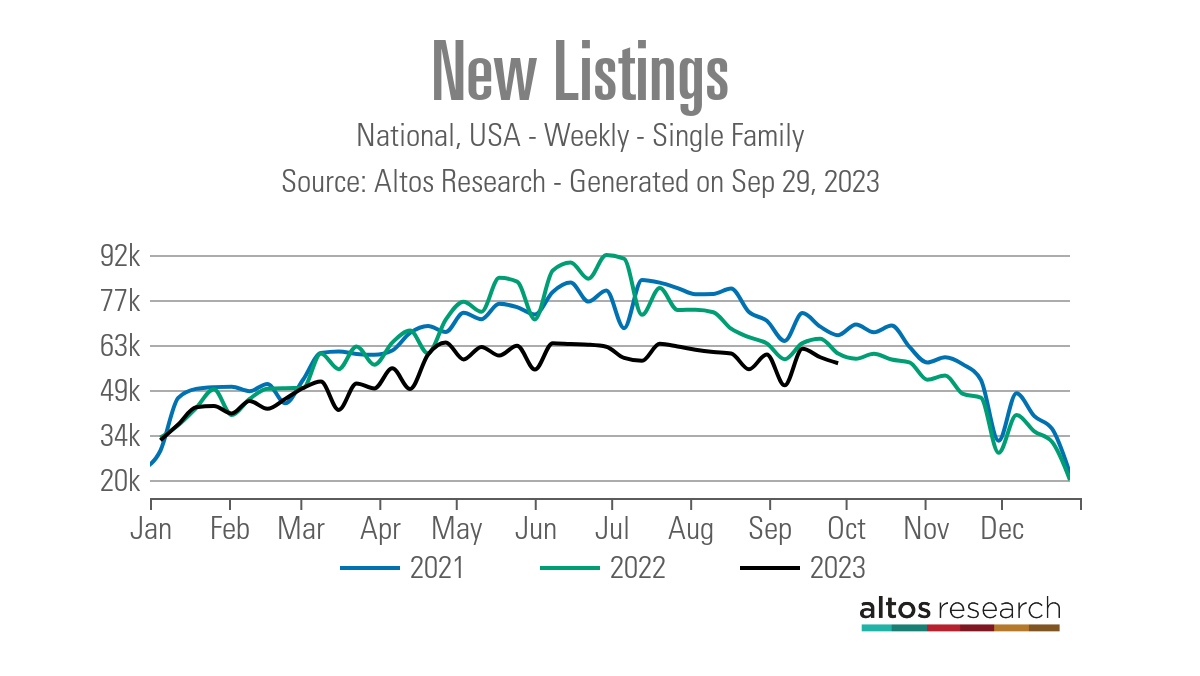
After some volatile weeks with the new listings data, things look similar to earlier in the year when we had an orderly seasonal decline in new listings data, which has been trending at the lowest levels ever for over 13 months. Even with rates spiking, the new listing data hasn’t created another new leg lower. This is important, as I expect flat to slightly positive data soon due to a shallow bar.
Historically, one-third of all homes have price cuts every year. Last week’s price cuts were lower than last year at the same time by 4%. This is happening even with rates over 7% and part of the reason is that housing inventory has been negative year over year since mid-June. As mortgage rates move higher, the percentage of price cuts can grow but it’s trailing last year’s percentage as home sales aren’t crashing like they did last year.
Price cuts for last week over the years:
- 2021: 29%
- 2022: 42%
- 2023: 38%

Purchase application data
Purchase application data was 2% lower last week versus the previous week, making the year-to-date count 17 positive prints, 19 negative prints, and one flat week. If we start from Nov. 9, 2022, it’s been 24 positive prints versus 19 negative prints and one flat week. The week-to-week data has gotten softer since mortgage rates have been trending above 7%. However, it’s not crashing like last year because we are working from a lower bar.

The week ahead: It’s jobs week! (If the government is open)
If we don’t have a government shutdown, the week ahead will be jobs week again! The Fed was happy about labor data last month as job openings have been falling, and the job growth data is cooling down. However, jobless claims are still going strong, so they have more work to do in attacking the labor supply. In addition to jobless claims, this week we will also have job openings, the ADP jobs report, and the BLS Jobs Friday report, which could move the bond market this week.
Also, I will watch this week to see if more Fed members comment about rising long-term rates. The Fed would like to keep rates higher for longer, but if the bond market gets a whiff of any terrible recession data, it will take yields down. So far, jobless claims data hasn’t given them any reason to do so.


