


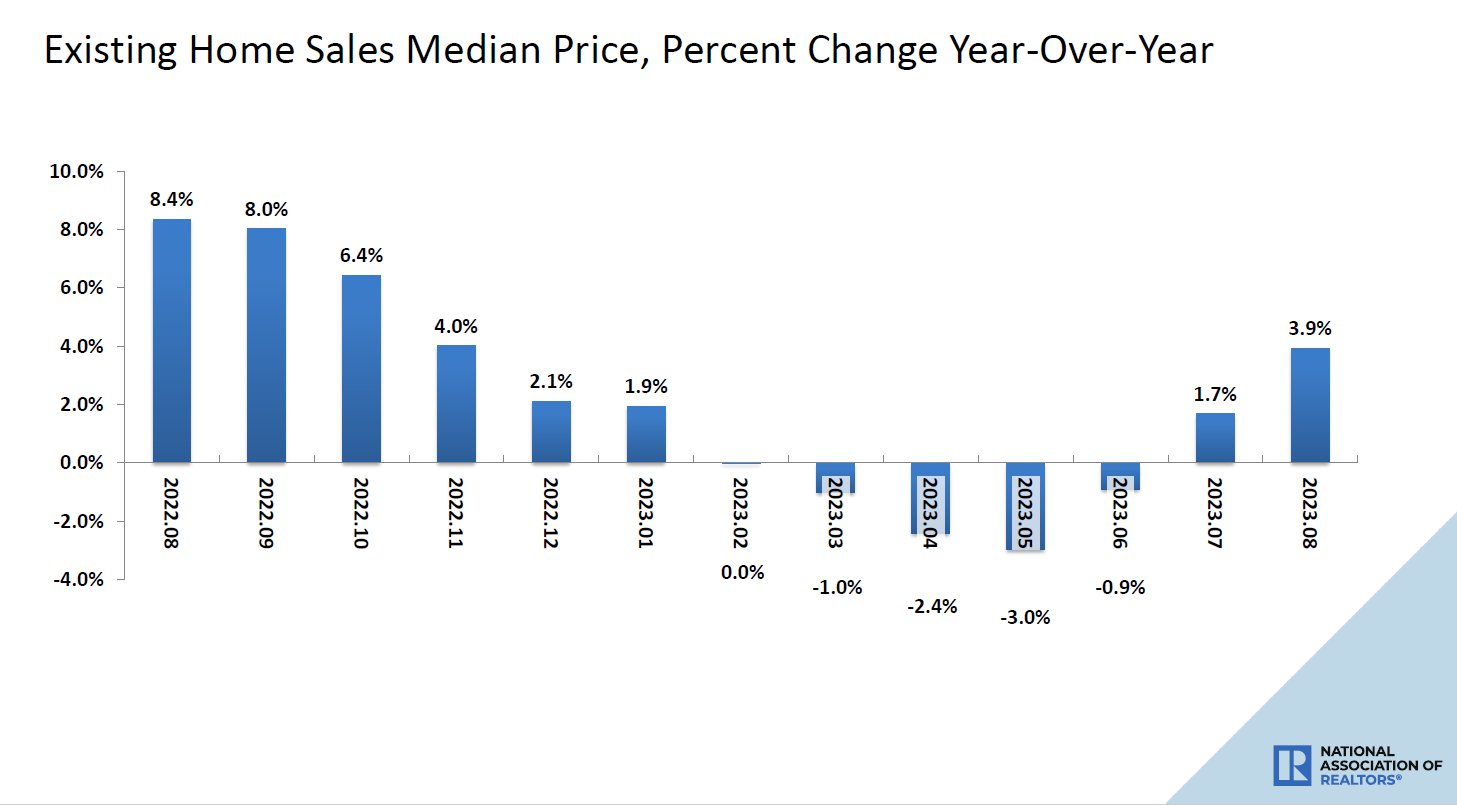
Existing home prices are up 3.9% year over year, with demand near 21st-century lows. How is this possible? NAR‘s existing home sales report on Thursday gives us insight into the why factor.
The median existing-home price for all housing types in August was $407,100, an increase of 3.9% from August 2022 ($391,700). All four U.S. regions posted price increases.
The simple answer is the same one I have been giving for years, especially after the summer of 2020: We have too many people chasing too few homes. We broke to all-time lows in active listings data in the worst time possible — the years 2020-2024, when home-buying demographics were the best in U.S. history, and we all paid the price with massive home price gains in a short amount of time.
The other difference in this housing cycle is that credit is very normal, meaning everyone has to qualify for a home loan these days, so sales have real potential to get hard with rising mortgage rates. This happened after March 2022 when rates spiked faster than any other time in recent history. But even with the biggest home sales crash ever, prices are still at all-time highs.
Ladies and gentlemen, this was the foundation core premise of the savagely unhealthy housing market: Home prices can escalate out of control in a low inventory environment, and even today, with demand low, we are still dealing with this issue in a lot of markets
From NAR:”Home sales have been stable for several months, neither rising nor falling in any meaningful way,” said NAR Chief Economist Lawrence Yun. “Mortgage rate changes will have a big impact over the short run, while job gains will have a steady, positive impact over the long run.
What else did we learn from today’s report?
Low housing comps for the rest of the year
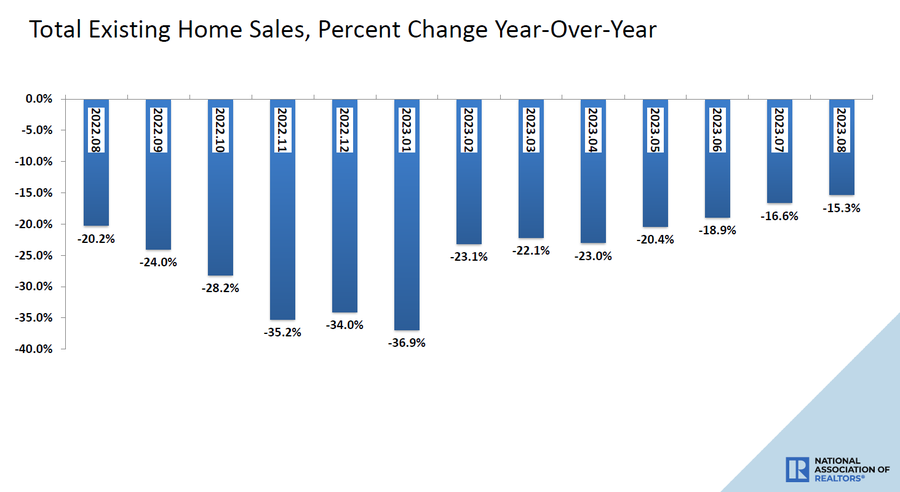
On the surface, housing looks like it is improving as the year-over-year sales decline decreases and the home price data grows. However, that isn’t the true story; it’s only true when you compare it to the biggest sales collapse period ever, which happened in the second half of 2022. Also, pricing was weaker in the second half of 2022 as well. It wasn’t just the seasonal price weakness last year; we had prices falling monthly to accompany that sales collapse.
So, when you see the year-over-year data get better, remember this context.
Year-over-year, sales fell 15.3% (down from 4.77 million in August 2022).
Inventory still negative year over year
From NAR: Total housing inventory registered at the end of August was 1.1 million units, down 0.9% from July and 14.1% from one year ago (1.28 million). Unsold inventory sits at a 3.3-month supply at the current sales pace, identical to July and up from 3.2 months in August 2022.
The housing inventory data has been negative year over year per the NAR data for the past few months. As we can see in the chart below, even with the biggest home sales crash in history for one year, inventory data has yet to return to the peaks we saw in 2007. Getting back to the four-decade average between 2-2.5 million has been a struggle.
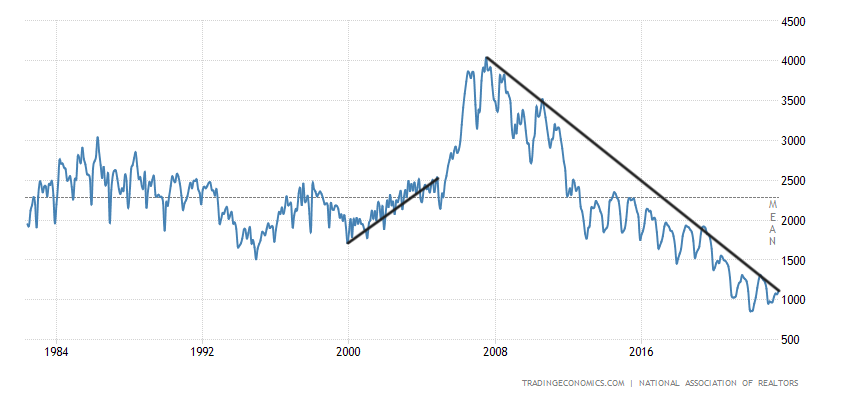
As I have stressed time and time again, when you have normal credit channels, meaning the people who buy homes are in traditional 30-year fixed loans, the inventory channels will behave differently than they did in the years 2000-2007. Remember, people don’t sell to be homeless; they sell to obtain shelter most of the time.
Why are home prices rising year over year? Simply put, inventory is low, and demand isn’t collapsing like it did last year. With mortgage rates rising again and running into the seasonal soft period, we can see the percentage of price cuts increase with more weakness in demand.
However, with all the data we have now in 2023, we have a better guide to use it going out in the future, and this is why this weekend’s tracker will be very critical to talk about since mortgage rates are near 21st-century highs again.


