


Today I’m going to focus on home prices around the country. How much will home prices climb over the next year? All year, the strength of homebuyer demand and the tight supply of homes for sale has meant that the market pretty rapidly found a floor on the home-price correction of 2022. Even as mortgage rates rose, and affordability was pushed out of reach for many potential homebuyers, there are still sufficient buyers who can afford these prices and these rates.
The number of buyers has been surprising. If you were looking at the market in the fall of 2022, you would have expected home prices to continue to fall further in 2023. That’s what I was expecting. But, the price correction stopped right after December 2022. In July 2022, we talked about how it looked like home prices would be flat at best over the next year. After the mortgage rate spike in September 2022, we got significantly more bearish on home prices for 2023. That bearishness from late last year has reversed. Demand picked up this year and home prices stabilized.
So now the question is: What do we know for the next year?
Zillow released a report that said they expect 6% home price gains for next year. If you haven’t been paying close attention to the data, that might seem shocking. So today we’ll look at the current price trends and the leading indicators to see if we can make some sense of where that comes from and what we can see already for 2024.
Prices
The leading indicators point to home prices at flat to slightly higher for the next 12 months. If mortgage rates decline say into the 5% range by next spring, I’d expect home prices to maybe appreciate 5% in that time. If mortgage rates stay near 7%, it seems hard for home prices to climb that much. If mortgage rates increase to the 7.5% or 8% range, then there is definitely downside risk for home prices. At Altos Research we do not forecast mortgage rates. But the forecasters we respect still seem to agree that rates have probably peaked and will be declining. That implies the higher end of our price forecast is likely.
Home prices now are essentially unchanged from 2022. It turns out that’s exactly what we estimated in July 2022 — that they’d be flat at best by this summer. That was coming off two previous years of 12-15% annual price gains. The path from 2022 to 2023 had a bigger crash and a faster recovery than I foresaw, so part of being right in that prediction was probably pure luck.
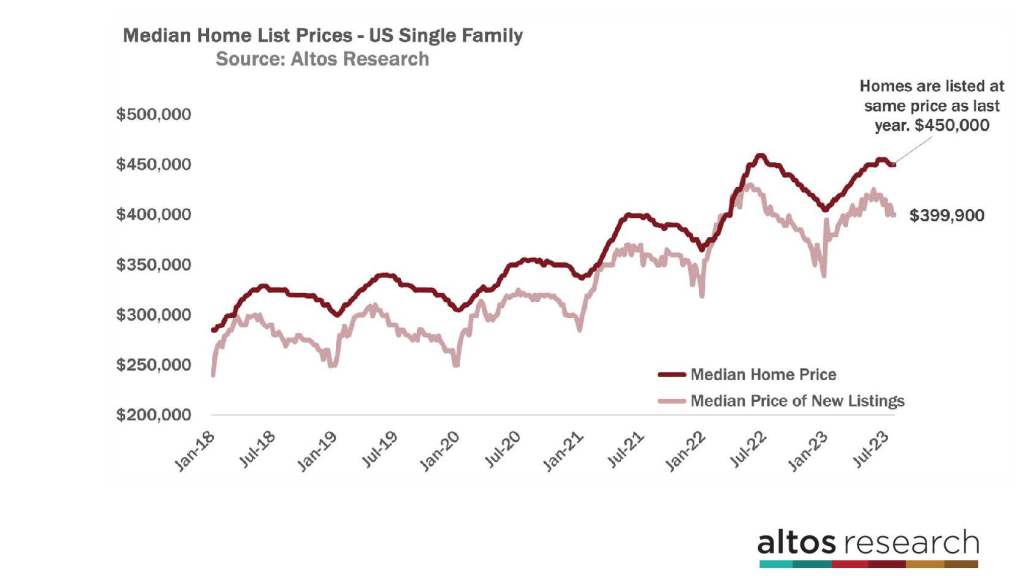
Nonetheless, the median price of single-family homes in the U.S. is $450,000. This is the median asking price, and it’s exactly flat from last year. That price is unchanged from the last few weeks. We like the median list price as a measure of the market better than the traditional view of median sales price because these are the homes you actually have to choose from if you walk into the market today. If you’re shopping for a home today, then the median price is $450,000.
The median price of the new listings this week is $399,900. That’s also at the same $400,000 level as in 2022 at this time. As the summer progresses, each subsequent week of new listings gets priced at a slight discount to the previous weeks. In August and September, the data will show if the discounts this year stay in line with the discounts for next year. Late in summer 2022 was when there were big mortgage rate spikes, a steep decline in buyer demand and quick discounts for the homes that were on the market. In the light red line of the chart, you can see how the seasonal discounting definitely accelerated in 2022. I think we’ll end the year with this leading indicator moving from flat to positive over 2022, meaning we’re set up for mild home price appreciation in 2023.
So our forecast for next year: Home prices are flat last year, but the annual comparisons get easier. By this time next year, home prices will be flat to slightly up over 2023.
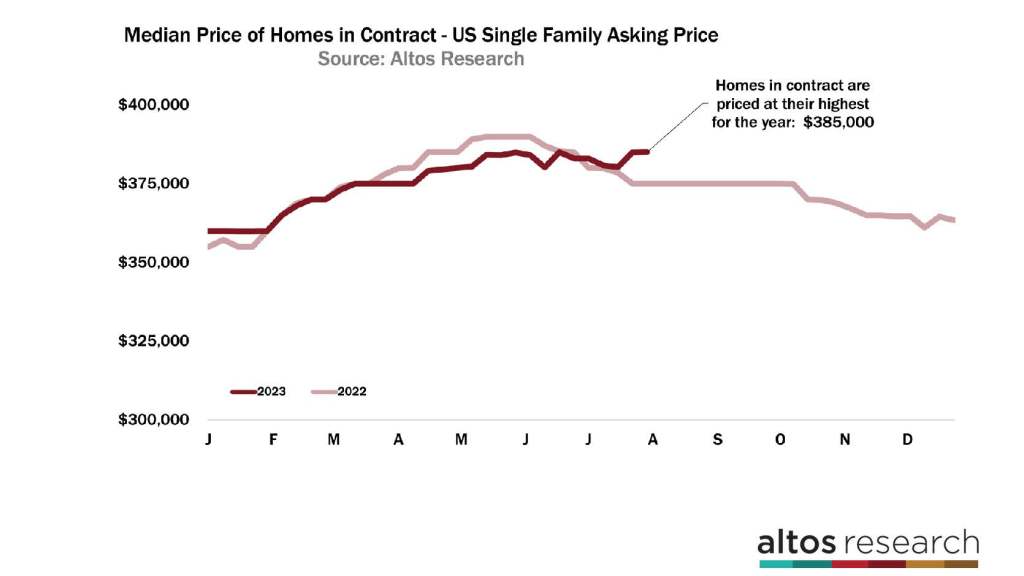
The next step in investigating the home price leading indicators is to look at the pending sales data. The median price of the homes in contract is $385,000. That number is unchanged from last week and almost 3% higher than a year ago. It is interesting that $385,000 this week is the high point for prices of the pending home sales for the year. Home prices peaked overall in June 2022 at just under $389,000. We didn’t re-reach that peak. Maybe we’ll pass it in 2024.
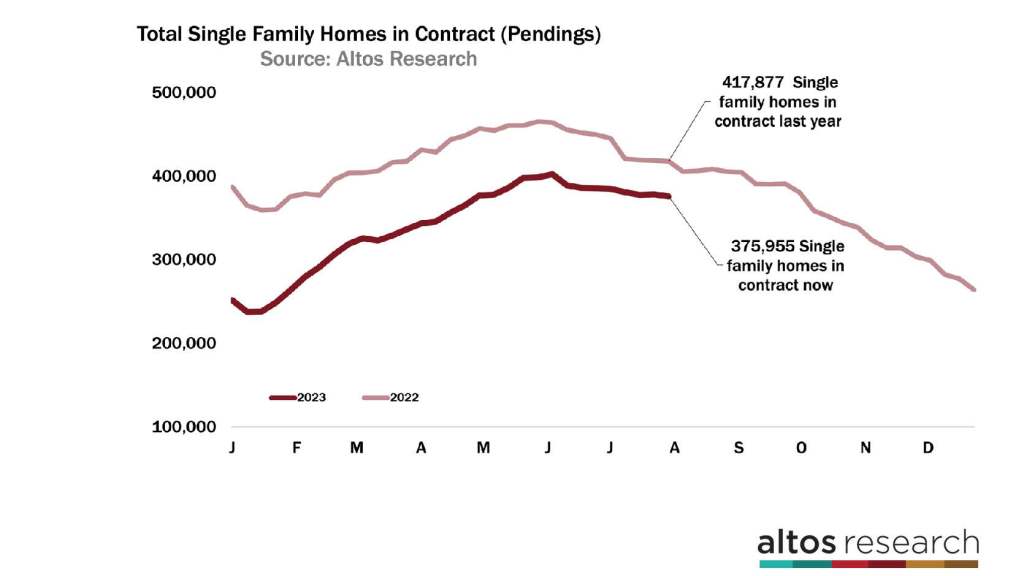
When we look at the total pace of sales, you can see that we’re still running at 10% less than last year. We started 2023 with 30% fewer home sales than in 2022. There are now 376,000 single-family homes in contract. In 2022 there were 418,000. You can see the gap from last year was narrowing. The dark red line has been approaching the light red curve of the pace from 2022. This year’s pace of sales recovery got derailed a bit in June when mortgage rates jumped from 6% to closer to 7%. Mortgage rates have stayed elevated. We can see a slight slowdown in this year’s recovery when rates reach 7%. Home sales slowed down dramatically after September 2022, but we’ll see if this year our pace holds. Maybe by Q4, we’ll have more homes in contract than there were at the end of 2022.
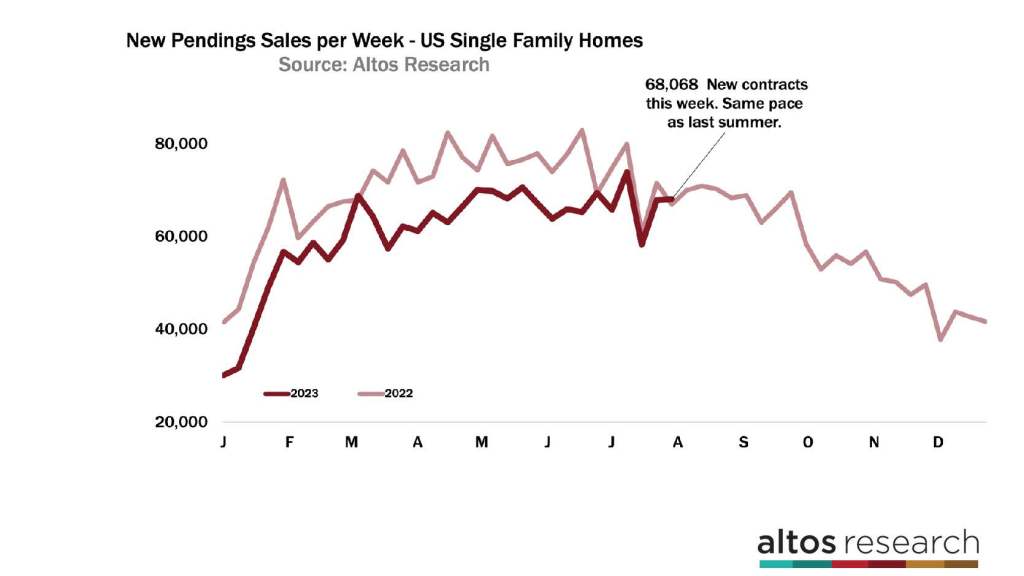
When you look at just the new sales each week, you can see how the pace of the market has recovered. The count of new contracts this week was just over 68,000 single-family homes. That’s still low, but the data has caught up with last year when the number of homes in contract was falling. See the last few weeks how the sales rate has been tracking just about the same as in 2022? Both lines indicate about 70,000 contracts. This is after significantly fewer sales all year long. 68,000 homes went into contract this week, while last year’s end of July saw 67,000 new pending sales for single-family homes. Early 2022 sales were still carrying pandemic demand. That demand shifted in July 2022, so the new sales volume each week is now an easier comparison and we’re at the transition point where the sale rate starts to overtake the prior year. This trend is why we’ve called it a soft landing for the housing market. Prices are flat year over year and the sales rate is not falling, it may be starting to increase.
Inventory
As a result, the seasonal inventory build is slow and on a normal cycle. There are 485,000 single-family homes on the market in the U.S. That’s up 1% from last week and is 10% fewer than in 2022 at this time. Inventory growth seems to have a few more weeks to go. Inventory will probably peak at the end of August like it did in 2021. In many years, the last week of July is the peak of inventory — like this week — but the data hasn’t shown a plateau yet so I expect we have a few more weeks of inventory growth. There are 50% fewer homes on the market now than there were in 2019.
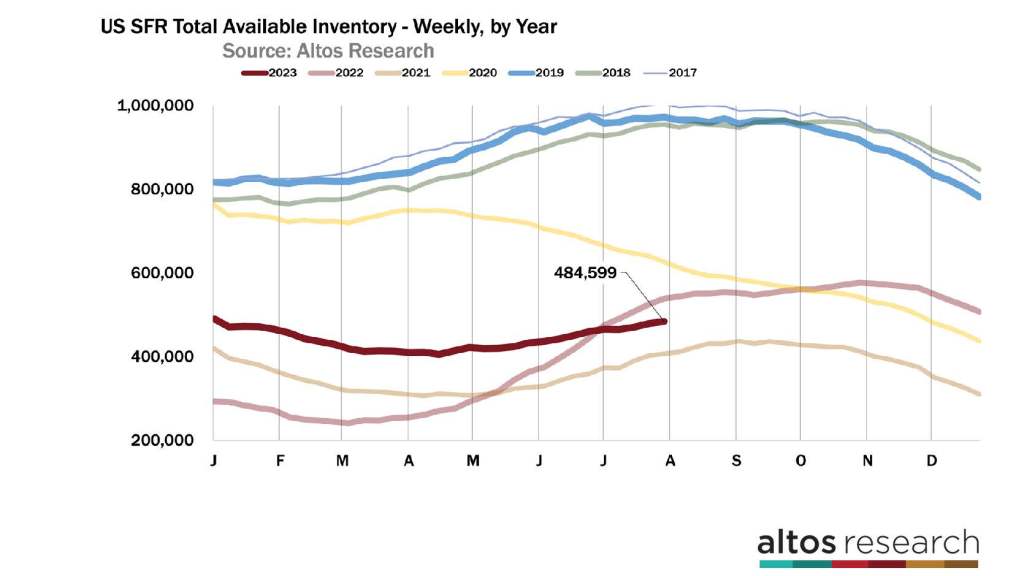
When you want to look at home prices in the future it’s helpful to look at inventory levels now. Specifically, examine the year-over-year change in inventory to project home price changes another year out in the future. When inventory falls from last year, that means demand is greater than supply and therefore there is sufficient demand to push prices higher. Conversely, when inventory is up year over year, that implies demand is less than supply and prices will be more likely to decline another year out. During the GFC, inventory rose in 2007, 2008, 2009 and 2010. Home prices declined subsequently. But since then demand has reversed, we were buying more homes than were available and inventory declined most years in the past decade.
Mortgage rates rose during 2018 which tempered demand. By early 2019, there was more available inventory of unsold single-family homes. That shift in demand that is first evident in inventory is a year later evident in home prices. By early 2020, home prices were flat from the year earlier. It took the incredible shocks of the COVID-19 pandemic to turn 2020 into such a roaring year of home price growth.
In 2022, as it became clear that inventory was growing dramatically, we could see demand from buyers slowing in a bunch of metrics in the real estate market. That’s why we were able to foresee this year’s home prices would be down. Which they have been until right about now.
Inventory is now 10% below this point a year ago. That tells us the housing market has more demand by buyers than supply from sellers. That dynamic helps us forecast that home prices will have upward pressure over the next year.
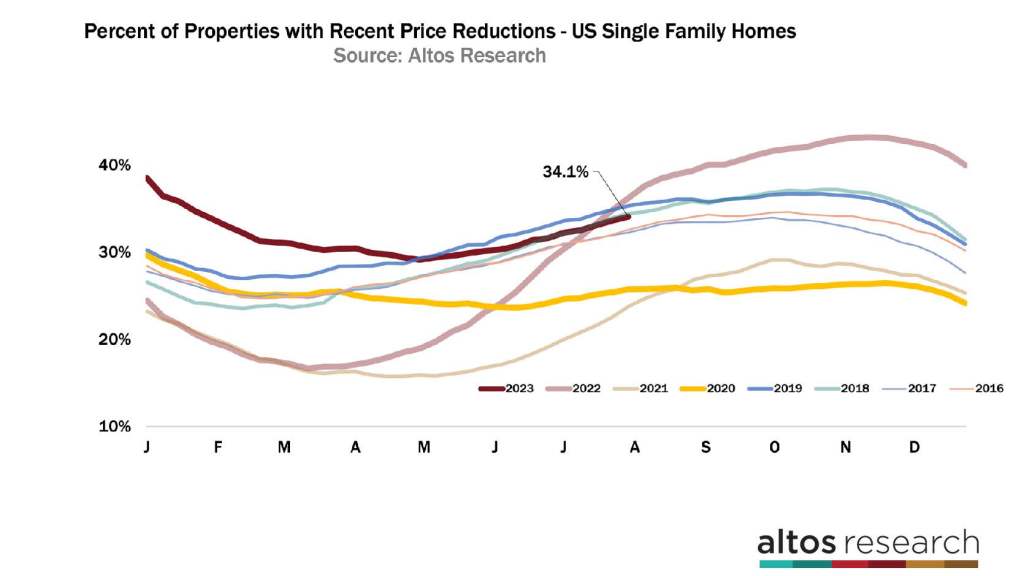
Inventory is a leading indicator for home prices for about 12 months in the future. Price reductions are a more immediate leading indicator for home prices. When the supply of homes for sale rises and demand does not, the homes on the market have to take a price cut. There are always homes on the market with price reductions. As a rule of thumb, about one-third take a price cut before they sell. When the market is hot, fewer than a third need to cut prices. When the market cools, more than one-third start cutting their asking price to find the demand. Right now, 34.1% of the single-family homes on the market have taken a price cut. Price cuts climb in late summer, so this rate is perfectly seasonal. You can see how the dark red line in the chart is in line with many other years. In 2022, the light red line was rising incredibly quickly. That indicated home price declines to start 2023 which is exactly what we saw.
The takeaway with the price reductions leading indicator is that we can see plenty of demand to keep a floor on home prices. Sellers are in much better shape than they were last year. This means that the homes on the market now are priced well, they have buyers, and therefore we already know that the sales that complete in August and September have price support. Home prices are not falling even though mortgage rates are high. There are plenty of buyers who can afford to buy.
However, 34% price reductions is not low. It’s not a hot market. Demand is obviously way down from the COVID-19 pandemic frenzy. So there’s nothing in the data that says home prices are surging from here. There’s nothing in the data that makes me particularly bullish on home prices. The real estate market is much more balanced than it has been in many recent years. When you see a forecast from a firm for example saying that home prices will climb 6% in the next year, I would presume that forecast includes assumptions that we avoid recession and that mortgage rates slide down from 7% to below 6%. When mortgage rates fall, that spurs demand, but not supply. Inventory will fall, buyers emerge and home prices will rise. At Altos we don’t forecast recessions or mortgage rates, so when we talk about our expectations for home prices in the coming year. We’re looking at the very direct data that’s already in the bag right now.
More next week.
Mike Simonsen is the founder of Altos Research


