Today, the U.S. Census Bureau reported that housing starts came in as a beat at 1.702 million for December. The more critical number of housing permits came in too strong at 1.873 million. You always want to be skeptical of any housing starts data that comes in too strong or too negative from the trend, and we had some specific factors in this report that boosted multifamily construction.
For example, the Census report included a special notice that the large increase (119%) in privately owned housing units authorized by building permits in the Northeast from November to December was influenced by real estate tax changes in Philadephia during that time.
The trend for housing starts is acceptable, but remember that this data line can be wild month to month, both positive and negative. So the trend is the most crucial factor here, and it’s OK for now.
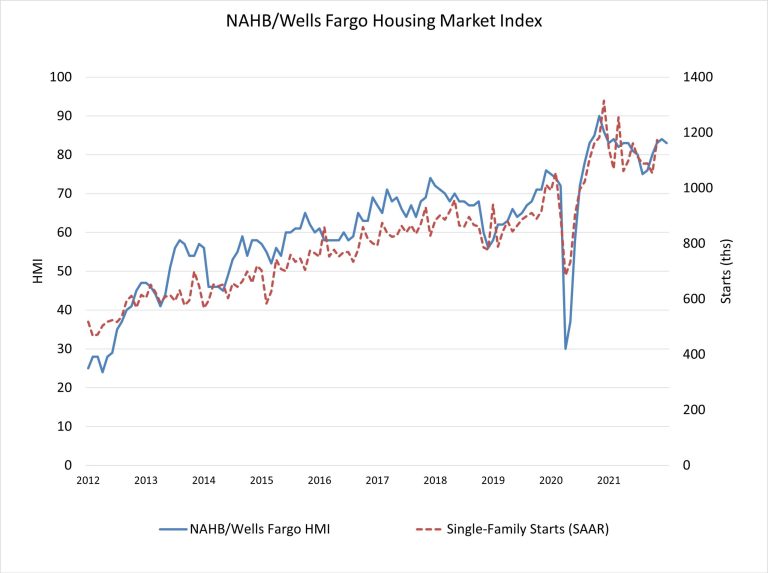
New home sales haven’t been booming lately, so the growth in single-family starts hasn’t either.
While the builders have been more confident lately, even with all the labor complaints, material costs, and delays, this story is still a slow and steady one.
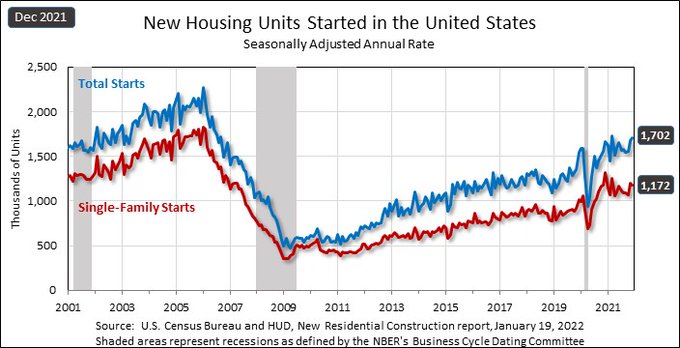
From Census: Housing Starts Privately‐owned housing starts in December were at a seasonally adjusted annual rate of 1,702,000. This is 1.4 percent (±10.1 percent)* above the revised November estimate of 1,678,000 and is 2.5 percent (±13.8 percent)* above the December 2020 rate of 1,661,000. Single‐family housing starts in December were at a rate of 1,172,000; this is 2.3 percent (±9.8 percent)* below the revised November figure of 1,199,000. The December rate for units in buildings with five units or more was 524,000.
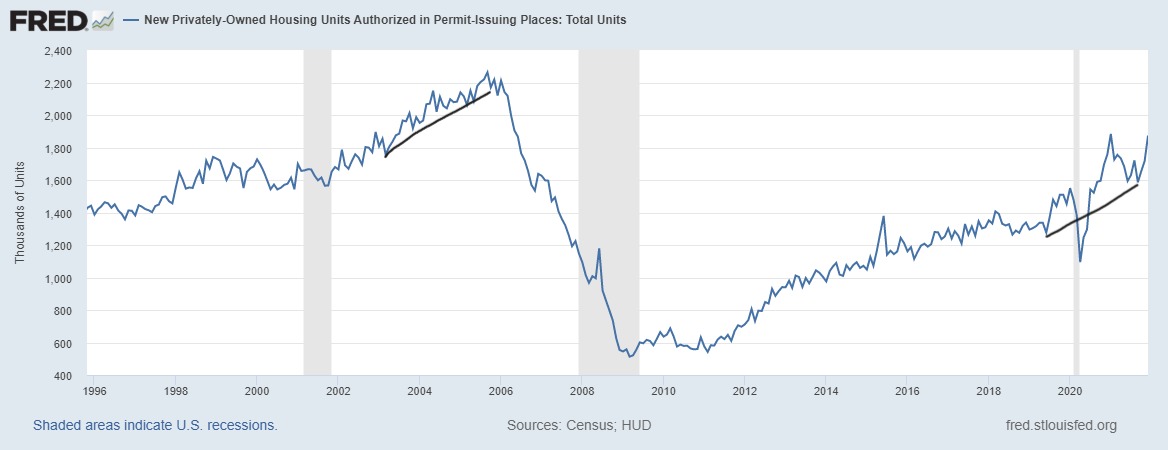
As we can see below, housing starts have had a slow and steady climb for many years, and we are nowhere close to the peak of the housing bubble years. Some of the demand that we saw from 2002-2005 was facilitated by credit that no longer exists in the marketplace today. We shouldn’t think of housing being led by a massive credit boom but more about demographics and the need for shelter.
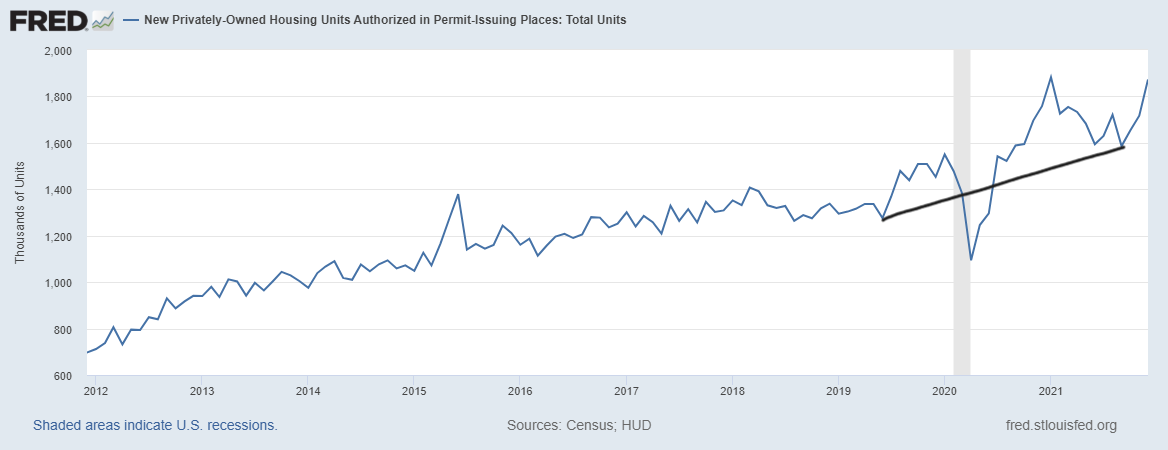
Housing permits had been picking up the past few months of 2021, and even excluding this one-month boost, of course, the trend here is still positive. Housing permits have always been a good leading economic indicator, so you always want to watch this data line. However, with that said, the low bar this data line had enjoyed from 2008-to 2019 is gone and we do need to earn growth in this sector.
From Cenus: Building Permits Privately‐owned housing units authorized by building permits in December were at a seasonally adjusted annual rate of 1,873,000. This is 9.1 percent (±1.1 percent) above the revised November rate of 1,717,000 and is 6.5 percent (±1.7 percent) above the December 2020 rate of 1,758,000. Single‐family authorizations in December were at a rate of 1,128,000; this is 2.0 percent (±1.3 percent) above the revised November figure of 1,106,000. Authorizations of units in buildings with five units or more were at a rate of 675,000 in December. An estimated 1,724,700 housing units were authorized by building permits in 2021. This is 17.2 percent (±0.6 percent) above the 2020 figure of 1,471,100.
The real story here in America in housing construction is the long delays in finishing a home which, is very obvious now in the housing data.
From Census: Housing Completions Privately‐owned housing completions in December were at a seasonally adjusted annual rate of 1,295,000. his is 8.7 percent (±14.5 percent)* below the revised November estimate of 1,418,000 and is 6.6 percent (±10.4 percent)* below the December 2020 rate of 1,386,000. Single‐family housing completions in December were at a rate of 990,000; this is 3.9 percent (±13.3 percent)* above the revised November rate of 953,000. The December rate for units in buildings with five units or more was 299,000. An estimated 1,337,800 housing units were completed in 2021. This is 4.0 percent (±3.2 percent)* above the 2020 figure of 1,286,900.
Honestly, this is one of the most pathetic-looking data lines ever in my life. Here we are at pre-cycle highs in housing demand, and not much going on here. I have been waiting for years 2020-2024 to come for the housing market, and getting hit with a pandemic was the most epic wild card ever.

However, you can see right here one of the main issues with the housing market in America today is that it takes a very long time to finish a home. This adds to my premise that this is the most unhealthy housing market post-2010, not because we are in a bubble, but because we are dealing with low inventory and too much cost and construction delays.
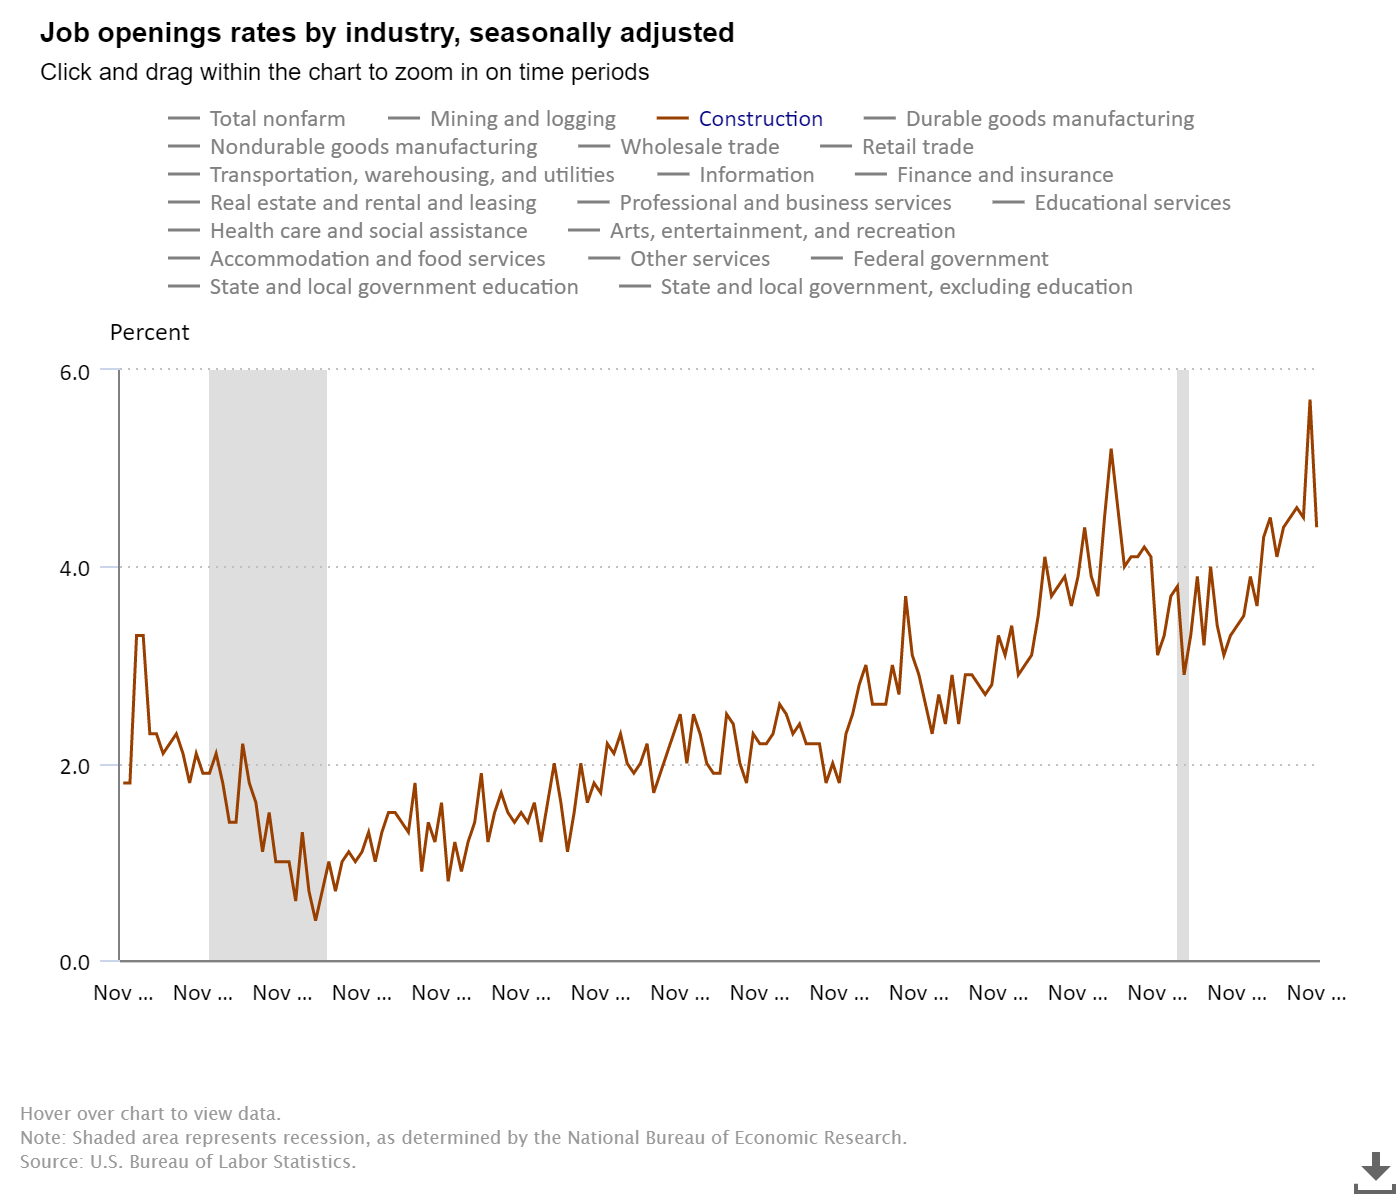
Regarding labor for housing construction, job openings are very high in the construction sector. Lack of labor runs in line with very high levels of job openings in America, so we have certain parts of the U.S that are fine with labor and others that are having issues. Again, this is a first-world problem to have.

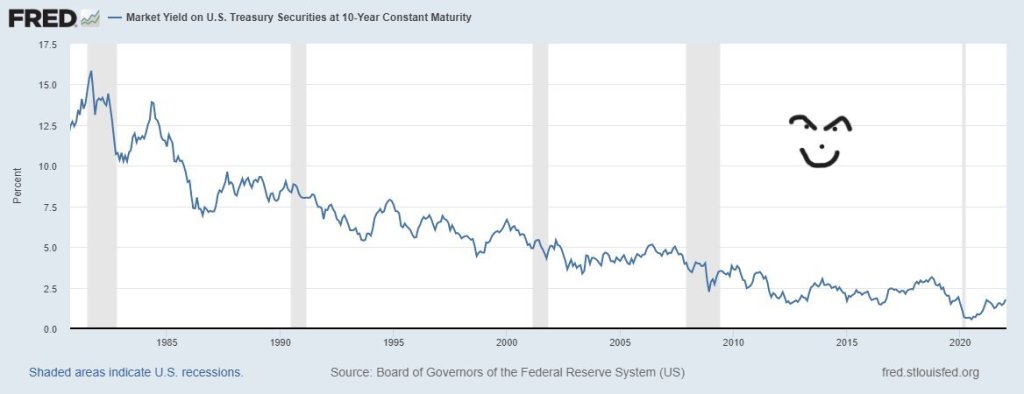
Next up for this sector is the new home sales report, and this sector is just OK: demand is good enough to keep housing construction moving along. However, I always caution that higher rates won’t crash a marketplace but can cool the rate of growth. The 10-year yield is making its first attempt to try to break above 1.94%, a line in the sand that has been very dear to me.
In December of 2019 I wrote: “Currently, the 10-year yield is at 1.88%. For many months on social media sites, I have talked about how important it is for the bond market to close above 1.94% — this would mean that the bond market has more confidence that we will have higher growth next year. Until then, I would be skeptical of any story that preidcts a higher rate of growth for 2020.”
Of course, the economic data was getting better in the second half of 2019, and in the first two months of 2020 the data was good. Then COVID-19 came and chaos engulfed the world. This time, we have a different story: the economy is on fire, the inflation rate of growth is the hottest in decades, and still today, the 10-year yield is currently at 1.84%.
My 2022 forecast is a bit different than 2021, as I talked about how we can break over 1.94%. However, this would require Japan and Germany bond yields to rise, which they have recently. So the backdrop is there now, but we shall see if it happens, because this 1.94% level has been very hard to break. As you can imagine, I am very excited; it’s been a while. Sticking with the theme that the trend is your friend since 1981; the 10-year yield would have to break over 2.70% to break that long-term downtrend.
I have noticed some of my bond bubble friends have popped their heads out, saying bonds are in a bubble, but never telling anyone how high yields will go. Remember, this is a marketing gimmick from the same bearish Americans who have been wrong for decades on this subject. I referenced them in 2020 because they’re usually housing crash addicts as well. “Personally, the housing bears for many years never talked about demographics coherently, and all had a bond market bubble conspiracy theory. These people are wild; we don’t have any other way to explain this kind of logic with the bond market after 40 years. I look at them as older men drunk at a bar going on their iPhone typing in the word bubble.”
From my 2022 forecast: “For 2022, my range for the 10-year yield is 0.62%-1.94%, similar to 2021. Accordingly, my upper end range in mortgage rates is 3.375%-3.625% and the lower end range is 2.375%-2.50%. This is very similar to what I have done in the past, paying my respects to the downtrend in bond yields since 1981.
“We had a few times in the previous cycle where the 10-year yield was below 1.60% and above 3%. Regarding 4% plus mortgage rates, I can make a case for higher yields, but this would require the world economies functioning all together in a world with no pandemic. For this scenario, Japan and Germany yields need to rise, which would push our 10-year yield toward 2.42% and get mortgage rates over 4%. Current conditions don’t support this.”
So all in all, a decent report not a great one. Excluding the one-time push in multifamily, it’s still the same slow and steady housing construction story with significant delays in finishing up homes and higher material costs. We shall see how the following new home sales report looks as the recent builder’s’ confidence index declined one point this week.
For now, keep an eye out on the 10-year yield and 1.94%, we haven’t been able to break this level in a long time and today it doesn’t look like that will happen either. Remember, higher yields don’t crash a market, but they do cool things down, and with our inventory crisis in 2022, this is what we need.