


Mortgage rates were near 7% last week but purchase applications were still able to pull out an 8% week-to-week gain. That was surprisingly strong, but as I have always stressed, context is critical. Purchase apps were coming off a four-week losing streak and even though those were mild week-to-week declines, it was still four weeks of weakness. The recent growth broke that streak, but demand is still low.
Active housing inventory grew while new listing data fell. Mortgage rates hardly budged last week, even with the Federal Reserve‘s announcement it was pausing rate hikes and CPI inflation reports.
Here’s a quick rundown of the last week:
- Active inventory grew 8,041 weekly. I am still hoping for some weeks that show inventory growth between 11,000-16,000
- Mortgage rates stayed in a tight range between 6.94%-6.98%
- Purchase application data showed an 8% growth week to week
Purchase application data
Last week’s 8% week-to-week growth with rates near 7% was stronger than expected. But, last year we had the biggest waterfall collapse in purchase application data ever for a single year, and since Nov. 9, 2022, this data has been forming a bottom-end range.
This dynamic changed the housing market from one where home sales were crashing to one that is now stabilized. I explain how this happened in this recent podcast. As you can see in the chart below, the collapse of the purchase application data has stalled out, and if this didn’t happen, we would be having a different conversation about the housing market today.
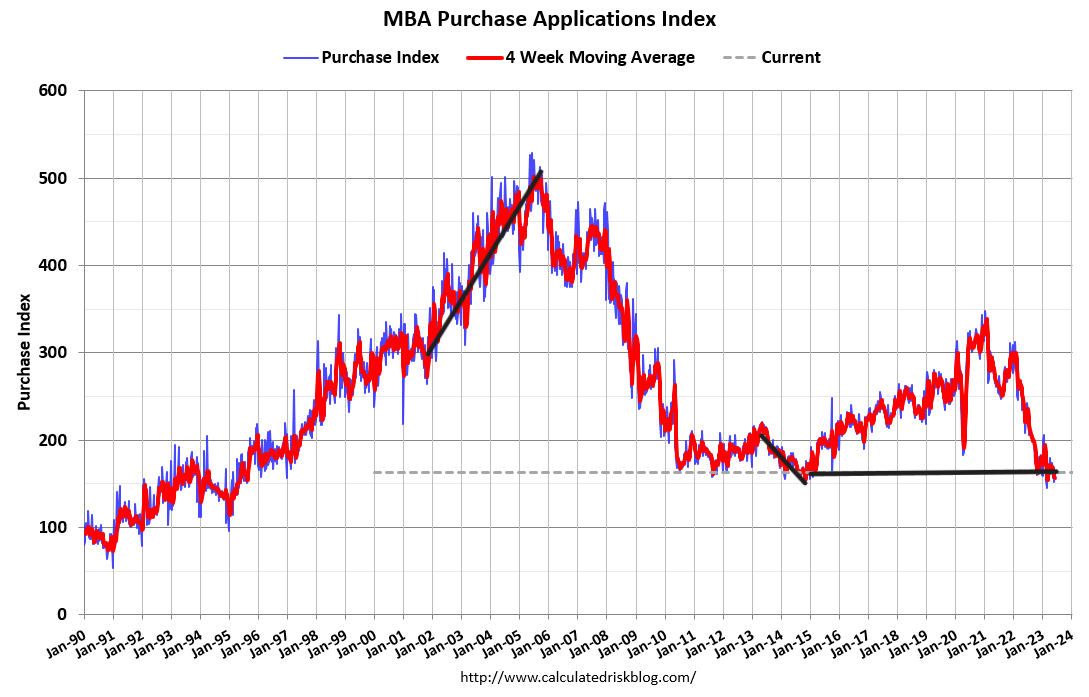
Nov. 9 is a critical date because that’s when the housing market turned. Since that date, the purchase application data, after making some holiday adjustments, has had 18 positive and 11 negative prints. Year to date, we have had 11 positive and 11 negative prints.
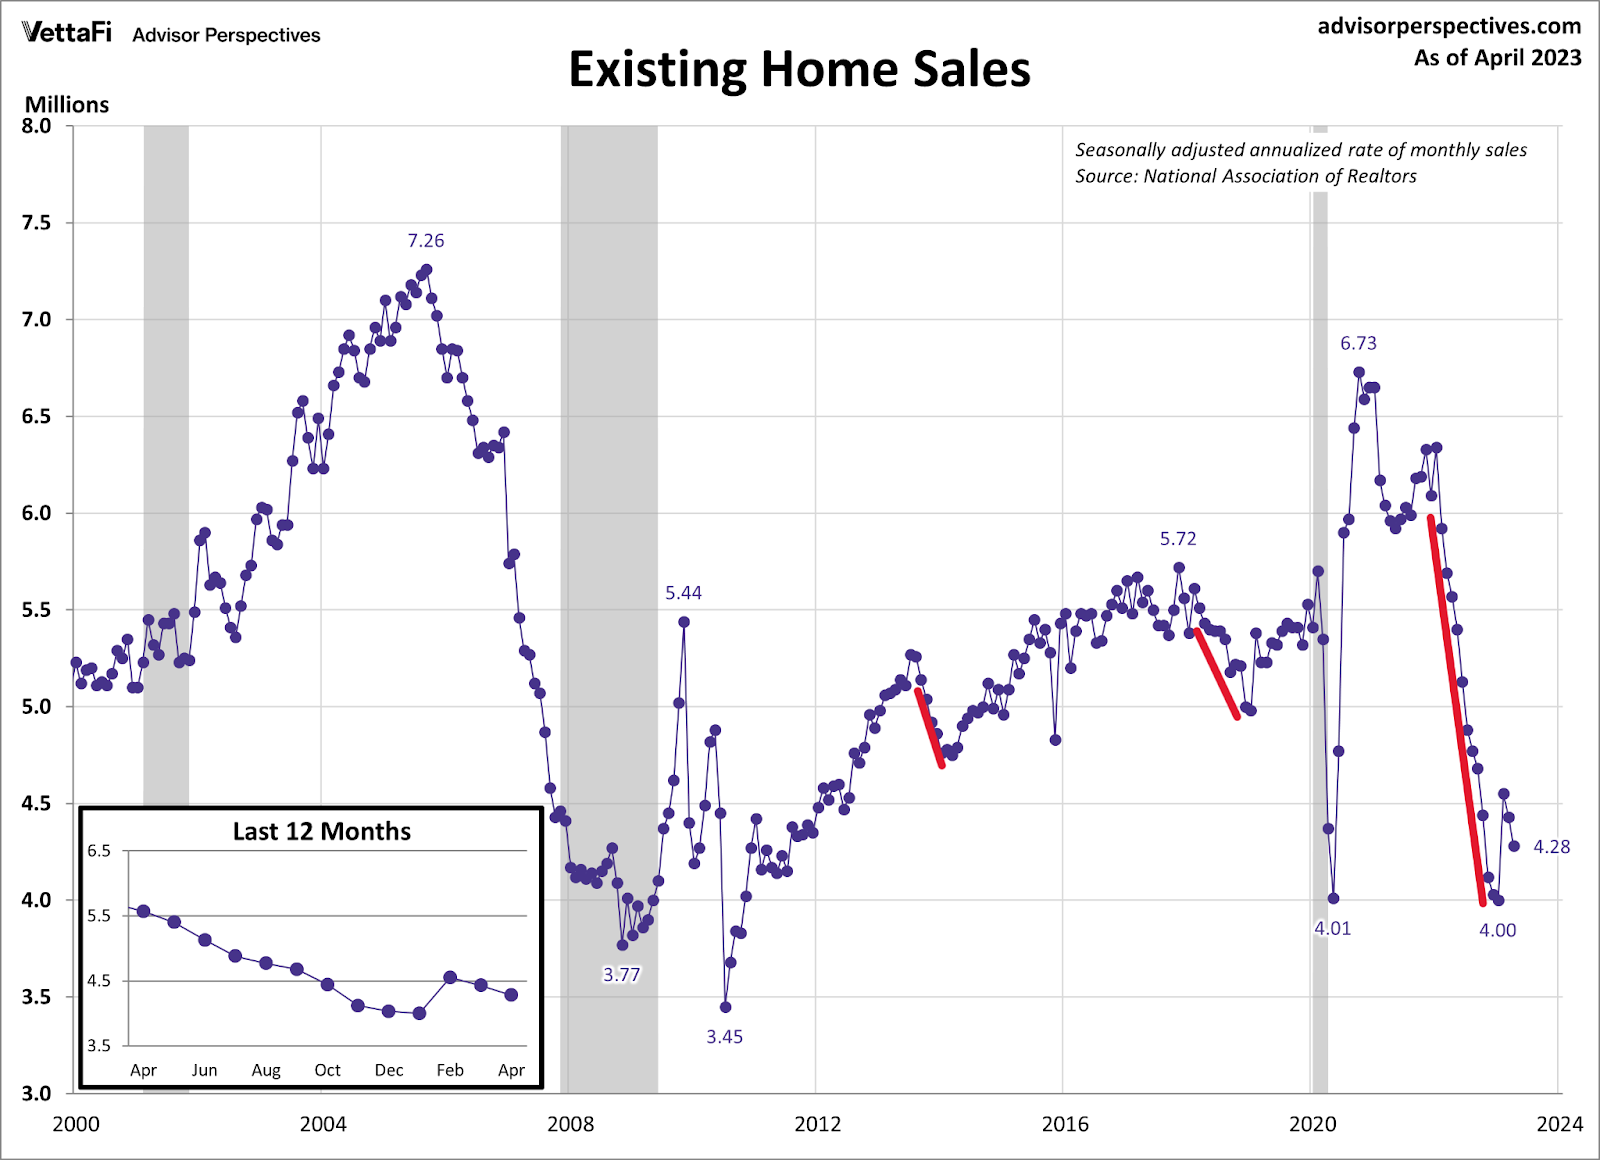
The growth we saw from Nov. 9 to February was long enough to give us the only big existing home sales print we’ve had this year. In fact, after that, not much has been happening, so the sale ranges should stay between 4 million and 4.6 million this year. However, if we get more weakness in purchase apps, there is a chance that this data line goes below 4 million.
Existing home sales are coming up, but I don’t expect any big surprises in this week’s report. We cannot break over 4.6 million this year unless we get a long string of positive purchase application data, which would require lower mortgage rates. Last year, when mortgage rates fell from 7.37% to 5.99% for a few months, we had a string of positive purchase application data that facilitated that big home sales print. Imagine what the housing market would look like if rates stayed between 5.5%-6% for a year.
Weekly housing inventory
This year’s housing inventory theme has been a walking dead musical chorus of a zombie trying to escape a grave. Slow and steady and late! It took the longest time ever recorded in U.S. history to find the seasonal inventory bottom, which occurred on April 14, and it’s been a slow rise since then.
But, it’s still a rise! A normal housing market always has a spring inventory increase and then inventory fades in the fall and winter. While I wanted to see more inventory growth this year, I will take what I can.
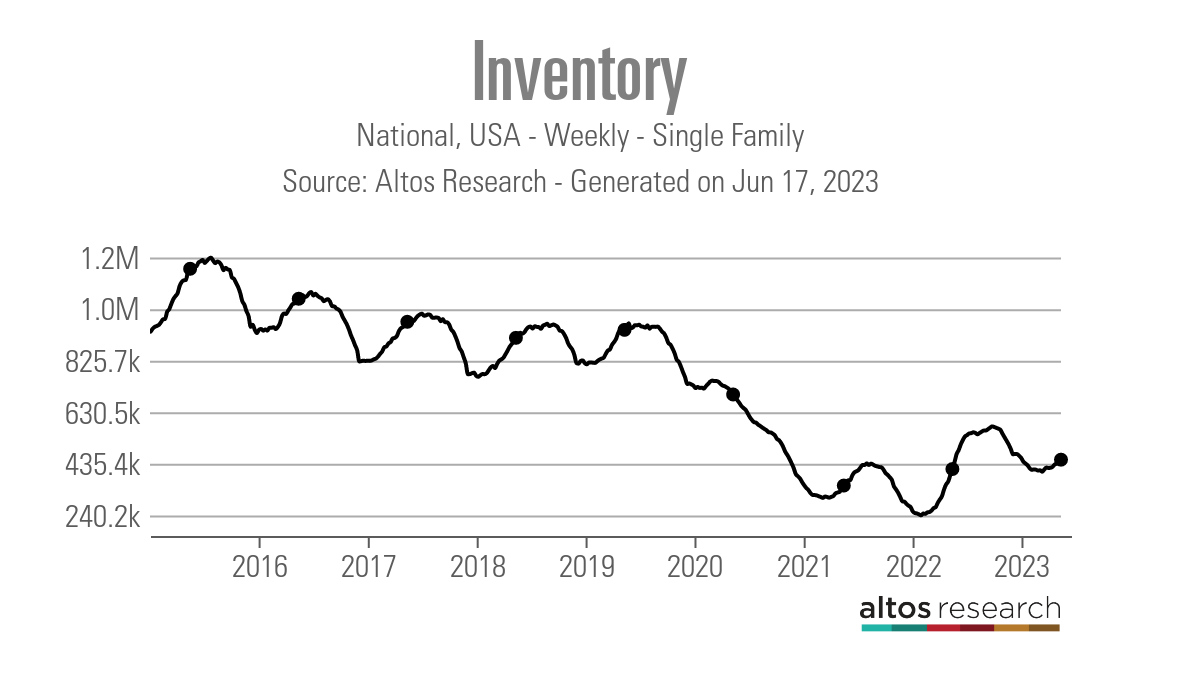
- Weekly inventory change (June 9-16): Inventory rose from 443,006 to 451,047
- Same week last year (June 10-17): Inventory rose from 392,792 to 415,582
- The inventory bottom for 2022 was 240,194
- The peak for 2023 so far is 472,680
- For context, active listings for this week in 2015 were 1,173,793
As you can see in the chart below, the inventory growth has been so slow that we are on the verge of showing some negative year-over-year inventory data. This happens with purchase application data being flat year to date. Of course, if we get some weakness in demand, then days on the market can grow and allow inventory to accumulate.
New listings data is another big story with housing inventory. Since the second half of 2022, it has been trending at all-time lows This trend has continued all year long, so we have limited new housing to work with.

Below are some numbers to compare the new listings data in recent years. As you can see, last year we were showing some year-over-year growth, but that’s not the case this year.
- 2023: 63,293
- 2022: 89,166
- 2021: 82,815
We only have a few weeks left before we will see the traditional new listings data decline and only a few months left before we see the traditional active listing supply decline. This week we will get the NAR existing home sales report, which will update that inventory data line, but total inventory levels are still historically low

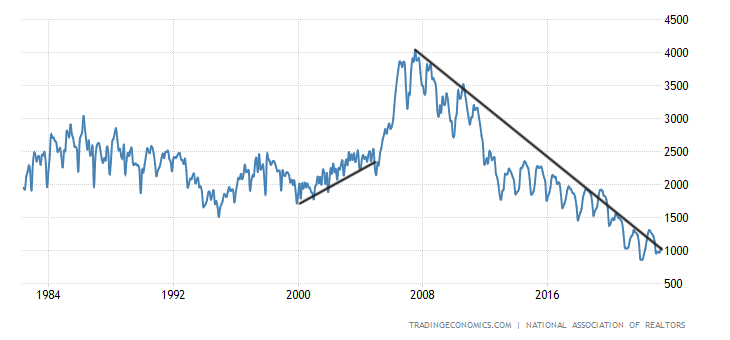
NAR total Inventory levels:
- Historically inventory is between 2-2.5 million
- The peak in 2007 was a bit over 4 million
- Currently we’re at 1.04 million
The 10-year yield and mortgage rates
We just had a surprisingly boring week with mortgage rates, considering we also had the CPI report and the Fed meeting. Not much happened last week with mortgage rates, as they stayed in a very tight range between 6.94%-6.98%.
However, the bond market had some exciting action that I should explain. First, the bond market didn’t react much to the CPI report; I wrote about the report itself here, which still shows the downtrend in the growth rate of inflation.
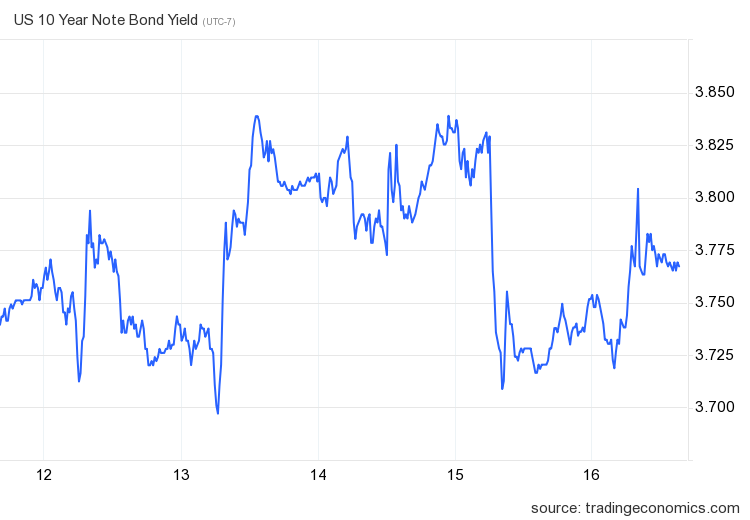
However, as I have noted in previous weekly tracker articles, we are having some tricky bond auction events since the debt ceiling action, which moved the markets last week. The market didn’t react too much to the Fed meeting, something I talked about on this podcast. With all those events happening last week, the chart below showed how the 10-year yield acted.
In my 2023 forecast, I wrote that if the economy stays firm, the 10-year yield range should be between 3.21% and 4.25%, equating to mortgage rates between 5.75% and 7.25%. As long as jobless claims trend below 323,000 on the four-week moving average., the labor market is staying firm, which means the economy is staying firm.
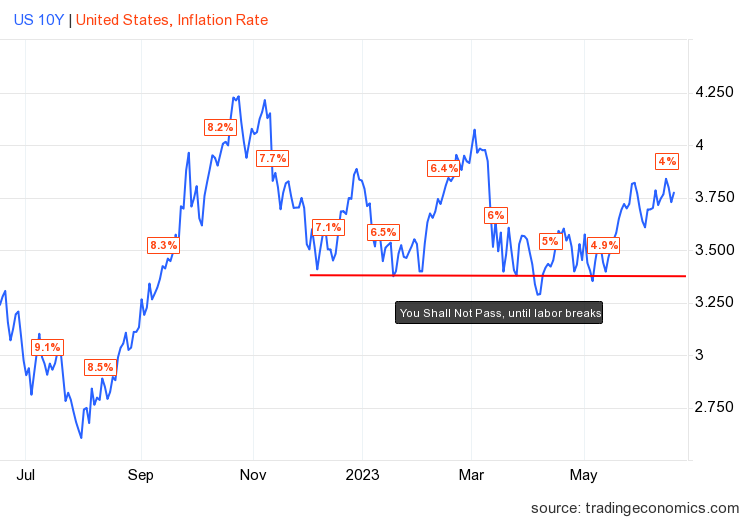
I have also stressed that the 10-year level between 3.37% and 3.42% would be hard to break lower. I call it the Gandalf line in the sand: “You shall not pass.” Yes, it might be corny, but I believed this level would be difficult to break under, and Gandalf had the right line for this bond market call.
So far in 2023, that line has held up, as the red line in the chart below shows. Mortgage rates have been in the range of 5.99%-7.14%. However, we do have some issues in the mortgage market.
Since the banking crisis started, the spreads between the 10-year yield and 30-year fixed mortgage rates have gotten worse, keeping mortgage rates higher than usual. As shown below, spreads made a noticeable turn when the banking crisis drama started and haven’t returned to the pre-drama trend. It will be a big positive for the housing market when this data line gets back to normal. However, until then, this has been a negative for the U.S. economy.
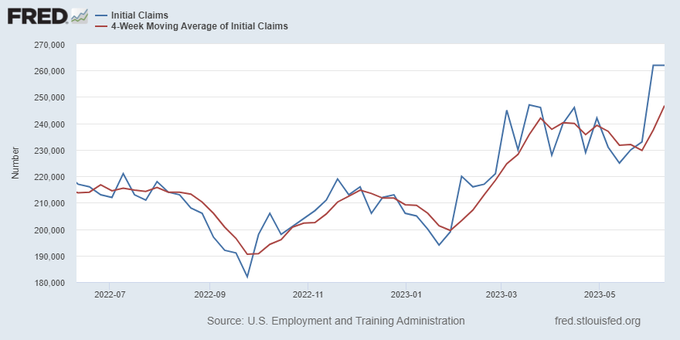
Another aspect of my 2023 forecast is that if jobless claims break over 323,000 on the four-week moving average, the 10-year yield could break under 3.21% and head toward 2.73%. Last week we didn’t have much movement here. However, as we can see below, the labor market, while still very healthy right now, isn’t as tight as it used to be.
From the St. Louis Fed: Initial claims for unemployment insurance benefits were little changed in the week ended June 10, at 262,000. The four-week moving average increased to 246,750
The week ahead: More housing data coming!
This week we have a series of housing data being released: Builder’s confidence, housing starts and the existing home sales report. Federal Reserve Chairmen Powell will also testify to Congress this week, which may produce fireworks. Of course, I am always mindful of the jobless claims data to see if we can spot more cracks in the labor market.
For housing starts, we want to see more completion of apartments because the best way to deal with inflation is always adding more supply, and we have a lot of 5 units under construction soon This is very key because without rent inflation taking off again, it’s impossible ever to have a repeat of the 1970s-style inflation.
So, let’s hope for some better housing completion data this week! The best news for mortgage rates is less inflation and the best way to deal with that is more supply.


I still think that there has to be some adjustment to the labor numbers with respect to the net new job growth. I didn’t think the number reflects the amount of workers retiring. It seems that so many people have retired and hence the net new jobs is over stating the strength of the economy. Another way to put it is that the shortage of labor that businesses are experiencing is not so much due to the strong economy, but because more workers are retiring than ever before.
I think there can be be interesting analysis of this by Logan.
If we didn’t have Covid19, total employment numbers would be between 157,000,000-159,000,000, taking three different variable trends of labor growth. So, we still haven’t made up for the lost period of Covid19 yet.