


Today new home sales beat estimates, and new home median sales prices hit an all-time high. What is going on here? My job is always to be the detective, not the troll so let’s take a look at today’s data, as there is a constant theme here that I have talked about for some time. Hopefully, I can make sense of this report, which showed the home sales beat estimates with prices still at all-time highs.
From Census: New Home Sales Sales of new single-family houses in October 2022 were at a seasonally adjusted annual rate of 632,000, according to estimates released jointly today by the U.S. Census Bureau and the Department of Housing and Urban Development. This is 7.5 percent (±20.8 percent)* above the revised September rate of 588,000, but is 5.8 percent (±19.6 percent)* below the October 2021 estimate of 671,000
New home sales haven’t gone anywhere for a few months now, and this report also had negative revisions to the prior reports. The cancellation rates are rising, this is true, but the Census reports don’t properly account for those sales being lost. In theory, the sales levels are lower than the data will show.
Also, these reports are very wild month to month, so we can get a swing back lower in next month’s report. However, with all that said, new home sales are historically low today and have been for some time. We are well below the 2000 recession level and back to 1996 levels.
When you account for a population of over 330 million people, that sales number looks a lot lower than in 2000 and 1996 so be mindful that we are trending at low levels today.
While the actual sales trends can be more downward than the report shows, it’s not off by a significant amount. We are, for now, bouncing off the bottom that we had back in 2018, which was historically low as well.

In 2005, when the housing bubble peaked in sales at around 1.4 million, we had a clear, aggressive downtrend in sales with cancellation rates rising aggressively. Today we are finding a low base for now, because new home sales are historically low.
I would be careful reading too much into this report or even the current trend. The housing market has been in a recession since June of this year, and we have other data lines that can be more useful in gauging the new home sales sector.

From Census: For Sale Inventory and Months’ Supply The seasonally adjusted estimate of new houses for sale at the end of October was 470,000. This represents a supply of 8.9 months at the current sales rate.
My rule of thumb for anticipating builder behavior is based on the three-month supply average. This also has nothing to do with the existing home sales market; this monthly supply data is only for the new home sales market.
- When supply is 4.3 months, and below, this is an excellent market for builders.
- When supply is 4.4 to 6.4 months, this is an OK market for the builders. They will build as long as new home sales are growing.
- The builders will pull back on construction when the supply is 6.5 months and above.
The existing home sales market has 3.3 months of supply, so we have had a historical gap between new and existing monthly supply for some time now. However, since I started my housing economic work, this has been my rule of thumb:
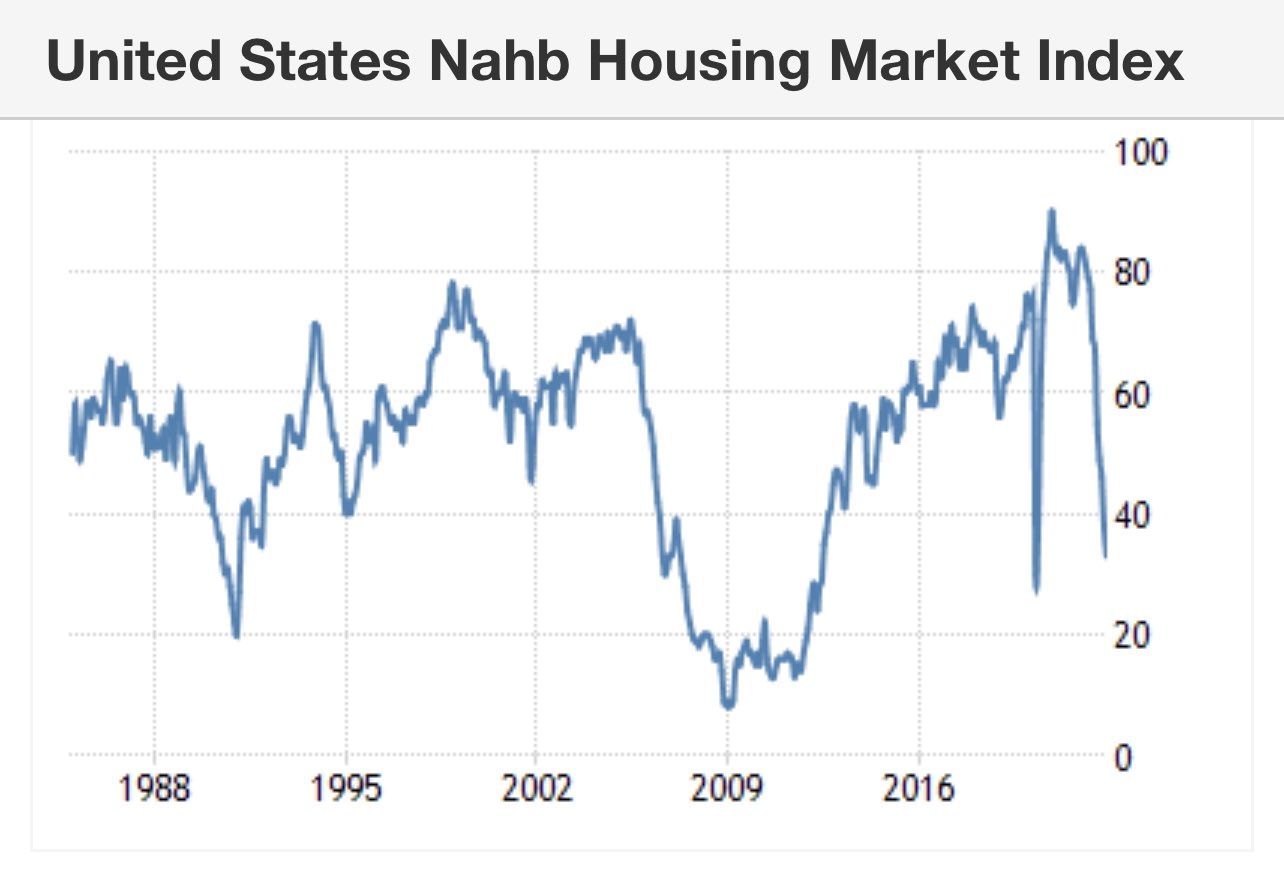
The three-month average of monthly supply in the chart above is running at 8.6 months, and the monthly supply headline number did fall for the previous report. This data line has always been key to my work, which has run well with the builder’s confidence data that has gone into waterfall collapse mode, as you can see below. This data line is considered positive when it’s above 50 and currently at 33.
We are still in housing recession land as the builders still have a lot of new construction homes and haven’t started yet to build.
For the builders, 61,000 new homes are completed for sale, amounting to 1.2 months of the supply, and 298,000 new homes are still under construction, while 111,000 haven’t started. The last two data lines account for 7.7 months left in the data.So as you can see, we have a lot of homes that aren’t on the market from the 8.9 months of the supply. We can see why the builders are done building new single-family houses as they have a lot of work left to do ( Article Link).
From Census: Sales Price The median sales price of new houses sold in October 2022 was $493,000. The average sales price was $544,000.
This part of the new home sales data has confused many people per the last few reports because it is true we have hit an all-time high in median sales prices for new homes. Over the past month of social media, I have tried to convey this message about using median sales price data for the new home sales market. This data line can move highly one way or another based on the mix sale shift of prices. This means that getting a report that has an outsized of bigger homes sold can tilt the data aggressively higher.


Earlier in the year, when we saw a more significant percentage dip in median sales prices, this was due to having more smaller-sized homes in the sales mix. Just know that median sales price data always need to be taken with a grain of salt.
Another housing data line reported today was purchase application data, which scored its third straight week of growth, coming in at 3% week over week. That data is still down 41% year over year, but as I’ve said for many months now, the year-over-year comps were going to be very difficult starting from October to January. This means we should expect 35%-45% year-over-year declines to be the norm. Right on schedule, since October we have seen year over year declines range between 39%-46%.

The last time we had three straight weeks of growth in purchase apps was the middle part of June. I caution that we are working from historically low levels, so the bar is low, but after three weeks of growth — and seeing the year-over-year decline become less — this is something worth noting. We will continue to keep an eye on this, especially if mortgage rates head lower.
I understand that the new home sales reports have been confusing at times this year but remember that the trend is your friend. We are working from historically low sales levels, and the builders are pulling out all the stops to sell what homes they can while rates are high.
The new home sales sector improved significantly when mortgage rates dropped to 5%. However, for now, the monthly supply levels are still too high for the builders to start new construction, and we can see they have a lot of work to do with homes still under construction.
With purchase application data showing some life now after mortgage rates have dropped, 2023 is shaping up to be very interesting. For now, I hope you can enjoy the Thanksgiving holiday with your family and eat well!


