


On Tuesday the FHFA House Price Index hit an all-time high. In this article I’ll explain why this is happening and why we still have a savagely unhealthy housing market. The quick takeaway here is that total active listings in the U.S. are still near all-time lows and the demand has stabilized.
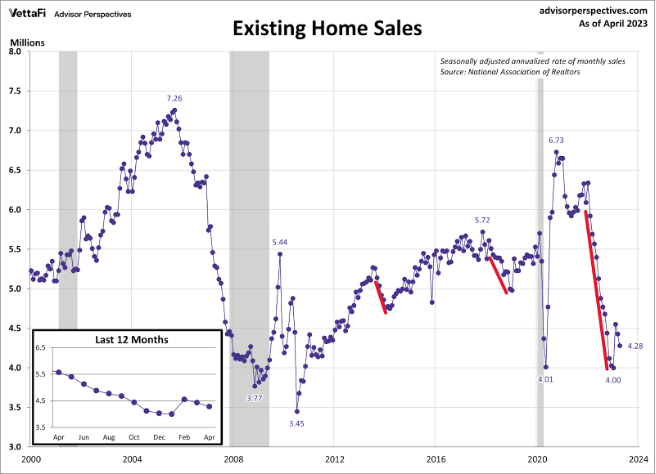
If home sales were crashing at the same pace they were last year, we would all be having a different discussion. This is why I have stressed that Nov. 9, 2022, was an inflection point in housing. It’s not because demand has rebounded in a big way, it’s just that home sales stopped collapsing as they did in 2022.
Forward-looking housing data flipped in November, so HousingWire created the weekly Housing Market Tracker to provide real-time forward-looking housing data. I also recently joined Mike Simonsen’s Top of Mind podcast to talk about what’s happened in housing over the past year. Forward-looking housing data might not be sexy, but it works.
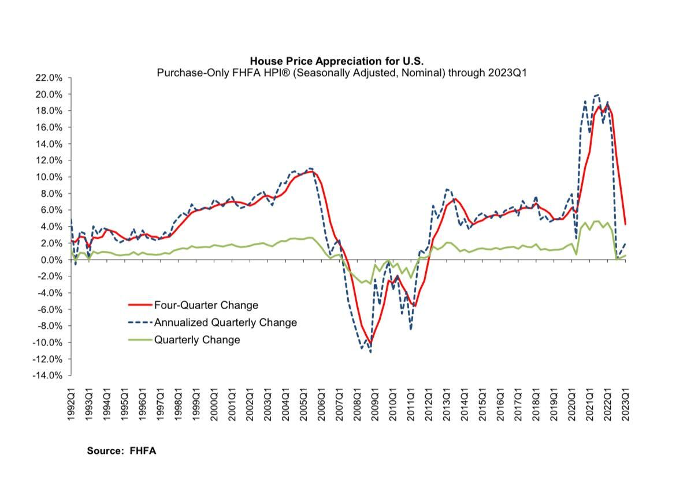
From FHFA: U.S. house prices rose 4.3 percent between the first quarters of 2022 and 2023, according to the Federal Housing Finance Agency House Price Index (FHFA HPI). House prices were up 0.5 percent compared to the fourth quarter of 2022. FHFA’s seasonally adjusted monthly index for March was up 0.6 percent from February.
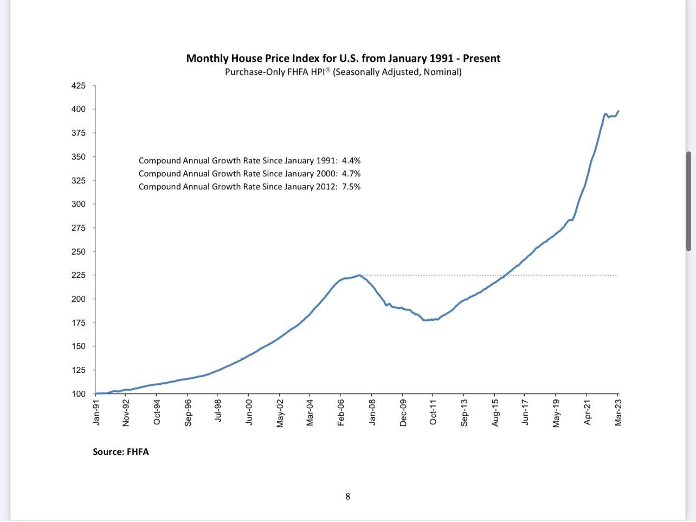
How and why did the index reach this high, and what should we expect in the future?
Inventory is still near record lows
The easiest economic discussion right now is the housing inventory story in the U.S. and that it’s historically low. However, it’s also the most-lied-about topic in recent economic history. People claim inventory isn’t low because “shadow inventory” is on the verge of adding millions of homes into the marketplace any second now. Another myth is that we’ll have a silver tsunami where every Baby Boomer lists their home in one month, flooding the marketplace with inventory.
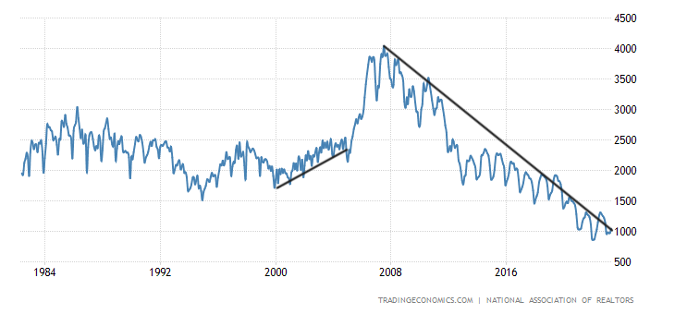
The NAR total active listings data is between 2 million and 2.5 million in a normal market between 1982-2023. Post COVID-19, we broke to all-time lows and it’s hard to get it back to those levels: we’re currently at 1,040,000 active listings. This is a fact that some people have a hard time believing because they believe the shadow inventory or vacant home thesis.
These are often middle-age male stock traders or anyone from the anti-central bank movement who has been part of a borderline crazy bearish American economic crash squad that only can be matched by the Russian troll movement spreading disinformation about the state of the U.S. economy. Economic cycles come and go, but the 24/7 doom porn people are a one-trick pony that will fall into the grave with all American bears who have failed since 1790.
NAR total inventory since 1982:
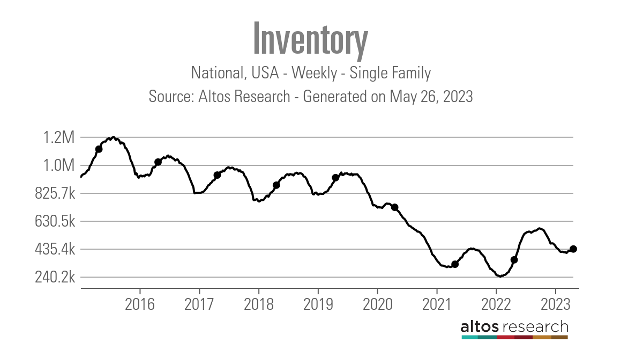
I prefer the Altos Research weekly single-family data to the NAR data because it gives us a fresh look at not only active listing data but new listing data. This way, nobody can be surprised when old stale data comes to the marketplace. This is also why we created the weekly Housing Market Tracker article. We want to connect the dots with supply and demand.
The Altos Research new listing data is essential in tracking the supply aspect of housing, which is why I include it as part of the Tracker. Even in 2022, when we had the most significant home sales collapse ever recorded, the new listing data never exploded higher; in fact, it was trending at all-time lows in 2021 and 2022, and now is at a new all-time low in 2023.
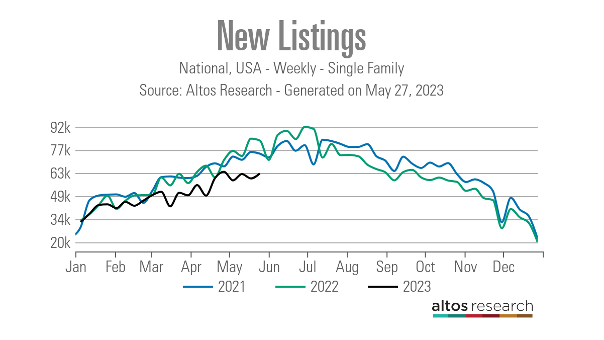
The data in the charts above should clear up any shadow inventory and vacant home nonsense we have heard for over 11 years. Let’s talk about the second significant factor: demand!
Last year was a whirlwind for housing economics. The first three months of 2022 were so bad that I deemed it the unhealthiest housing market post-2010. I coined the term savagely unhealthy because we had too many people chasing too few homes. More than 70% of the marketplace saw multiple bids on properties.
In February of 2021, I talked about how we needed higher rates to cool down the housing market because this wasn’t the housing bubble of 2005. However, by February 2022, it was too late; so much home-price growth in such a short time meant that demand would collapse when mortgage rates did rise.
Mortgage rates going from 3% to 5% had been the norm for the markets; mortgage rates going from 3% to 7.37% was another story altogether. As a result, home sales collapsed in 2022 in the most prominent fashion ever recorded in U.S. history.
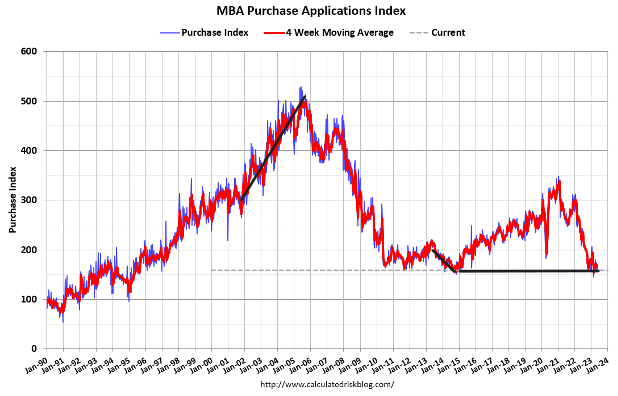
So what has changed? Well, starting Nov. 9, 2022, mortgage rates fell and mortgage demand got better. We didn’t see a recovery in demand, it just stabilized.
Since Nov. 9, purchase application data has had 17 positive prints versus nine negative prints after making some holiday adjustments. Year to date, we have had 10 positive prints and nine negatives, and tomorrow purchase applications should be negative, which shows the stabilization in demand so far in 2023.
It is simple supply and demand economics. Last year, home sales crashed because mortgage rates exploded higher after the most significant short-term home-price gains ever in history. However, after Nov. 9, that reality changed from crashing home sales to stabilizing.
So the moral of the story is that the market dynamics were very historical last year; active inventory and monthly supply were low, but home sales were crashing, and the inventory that was on the market, especially in the seconnd half of 2022, required price cuts to sell.
In my 2023 forecast for prices, I stated that mortgage rates needed to stay higher, above 5.875%, for prices to have a mild decline, in contrast to the massive price gains we have seen in 2020 through 2022. I chose 5.875% because my affordability index model was shot, but I also saw that the housing market changed when rates moved from 7.37% to 5.99%.
Imagine what the housing data would look like if rates were in the low 5% for 2023. This is why tracking weekly housing data is critical. We don’t have a housing demand recovery as we saw with the COVID-19 recovery, we just have a stabilization in demand, and total active listings are still near all-time lows.
As you can see in the FHFA home price index below, the growth rate of prices cooled down a lot with higher mortgage rates, but those didn’t crash prices like in 2007 and 2008, a period in time with much higher active supply.
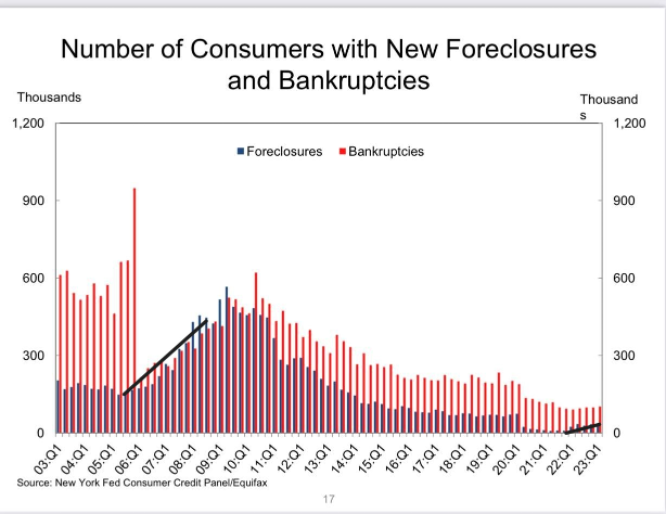
Also, to go along with the FHFA home price index, not only was housing inventory over 4 million in the NAR data in 2007, but we also had massive growth in forced sellers. As we can see in the chart below, we had massive credit stress in the system.
So, as we get ready for the second half of 2023, we will track the weekly housing data. We will focus on the actual data that matter, positive or negative. The most significant change this year is that home sales are not collapsing in the same fashion they were last year.


