


Today, we saw existing home sales slip a bit month to month, which isn’t surprising to me as purchase application data started its positive run in November. That data line typically looks out 30-90 days for sales — it doesn’t move as fast as some people think. Since making some holiday adjustments, we have seen a seven-week positive trend in purchase apps since November.
Today, we need context for the growth we’ll see in existing home sales in 2024. We are working in the third calendar year of great recession lows in demand, with a population of over 335 million and over 157 million people working. I always stress this because of my core belief that it’s rare in America to have existing home sales trend below 4 million after 1996. It happened in 2008 and then didn’t happen again until 2023.
We don’t have any data that shows sales are crashing from this low level: this is key when looking at the future because it does give us a place to grow sales as long as mortgage rates fall.
From NAR: Existing-home sales waned 1.0% in December to a seasonally adjusted annual rate of 3.78 million. Sales faded 6.2% from the previous year. The median existing-home sales price rose 4.4% from December 2022 to $382,600 – the sixth consecutive month of year-over-year price increases.
Below are charts with today’s report and the trend. Remember, with median sales prices and inventory, it’s very seasonal.
Something notable about this report: Total active listings as the NAR tracks them almost broke under 1 million again. However, remember, the dive in inventory is normal at this time of the year. Our housing market tracker counts weekly active single-family listings, those homes that aren’t in the contract, and the raw available number of homes for sale. This is why the Altos Research numbers we cite are always smaller than the NAR numbers, which accounts for all home types and those in contract. Our tracker articles have a lot more details about the current weekly market and we publish those each Saturday.
From NAR: The median existing-home price for all housing types in December was $382,600, an increase of 4.4% from December 2022 ($366,500). All four U.S. regions posted price increases.
One thing about the median sales price index is that it’s showing hotter month-to-month price growth in the last few months of the year. This sounds odd to people because mortgage rates went all the way to 8%, and price growth was picking up. Just remember, the year-over-year comps were very easy because home prices were declining in the second half of 2022, so we have easier comps to work from.
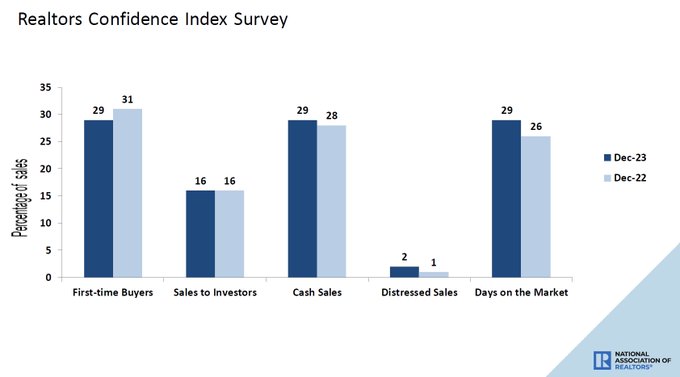
From NAR: First-time buyers were responsible for 29% of sales in December; Individual investors purchased 16% of homes; All-cash sales accounted for 29% of transactions; Distressed sales represented 2% of sales; Properties typically remained on the market for 29 days.
My entire theme around the savagely unhealthy housing market is based on the premise of too many people chasing too few homes. Whenever the days on the market fall to a teenager level, nothing good happens in housing. The days on the market are also very seasonal, and even though we got close at 29, I had hoped we would be 30 days plus by now.
However, we will soon be extending the months where we see the seasonal decline, so one or two more reports will be needed to get my 30-day wish. To give you all some perspective, this data line dropped all the way to 14 days in the crazy period of COVID-19, while back in 2011, it was 105 days.
Yesterday on CNBC, I talked about the state of the housing market and how important it was that the builders’ confidence data was rising because that keeps construction workers employed and building homes. This is related to the fact that even though the apartment boom is over, single-family permits are still rising. We have a big difference in the data on single-family permits and 5-unit permits. I call it an alligator chart opening its mouth, see below.
In the CNBC interview, I stressed that we do have one positive on the inventory side of things: we are seeing new listings data growth. This is a positive for housing in 2024 as most sellers are buyers.
Overall, no surprise in the existing home sales report: We will see a demand increase in the following few reports to tie in with the purchase application data. However, the main point of this article is to make sure we all know we are working from the lowest sales levels ever when adjusting to the workforce, and we have good demographics in 2024. With that in mind, be reasonable on the growth levels we have in the future.


