

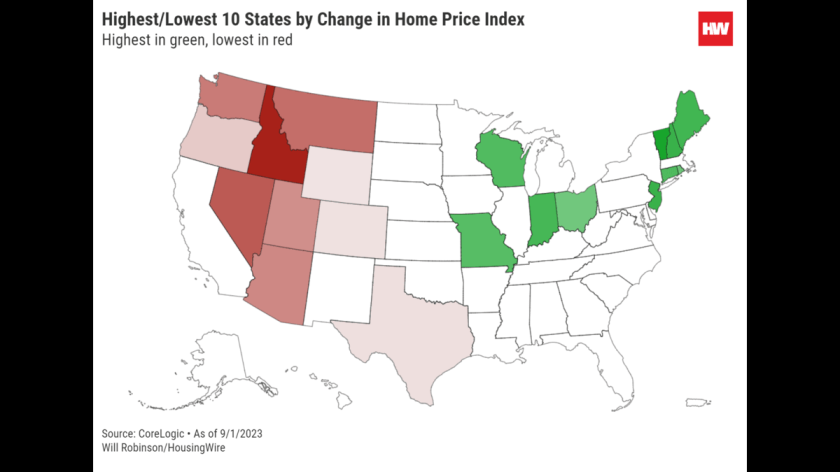
Housing markets in Western states like Idaho, Wyoming and Utah are stumbling on a year-to-year basis, while markets east of the Mississippi are heating up, according to CoreLogic data provided exclusively to HousingWire.
As of Sept. 1, the top 10 states by year-to-year growth in the CoreLogic House Price Index are located exclusively in the Midwest or Northeast, with Vermont’s 8.52% gain leading the nation. The bottom 10 states, by contrast, were concentrated in the West, with Idaho’s 5.68% drop representing the largest decline nationwide.
CoreLogic’s index is based on real-estate public records, servicing and securities databases, including more than 40 years of repeat-sales transaction data. Its index is the most up-to-date, with others like Realtor.com‘s “market hotness” scores pegged to August and the S&P/Case-Shiller Home Price Index tied to June.
What is true of states is also true of cities. Metropolitan Statistical Areas in the Southeast and Midwest dominate the list of the top 10 MSAs by price index change, while MSAs in Wyoming, Idaho and Oregon frequent the bottom 10 list.
A lack of inventory nationwide continues to push up prices.
While there appears to be a clear regional winner and loser in CoreLogic’s Home Price Index, the picture is murkier with median rental prices.
Oregon did see the nation’s largest drop at 2.68%, and Idaho, Utah, Nevada and Colorado join Oregon amongst the bottom 10 states as ranked by median rent price growth.
However, Northeastern states including New York and Rhode Island as well as Midwestern states including Ohio and Minnesota are also in the bottom 10, while the West’s Wyoming, Montana and Arizona landed in the top 10.
A clearer insight from rental price data is that the Southeast saw significant price increases. Arkansas tallied a 37.42% increase, South Carolina a 23.77% gain and Florida a rise of 20.5%.
Rising rents have been exacerbated for low-end, single-family rental units, CoreLogic’s Single-Family Rent Index recently showed.
The year-over-year change in foreclosures essentially splits the difference between the prior maps.
Foreclosure counts increased the most in the West, with North Dakota, Idaho and Utah all surging more than 30%; those led the nation, excluding Washington D.C.’s 103.85% spike. Foreclosure counts decreased the most in the Southeast, topped by Arkansas’s almost 19% decline.
However, Pennsylvania, Maryland and Kentucky’s noticeable foreclosure increases complicate the thriving-East/struggling-West narrative. It is not immediately, however, how the ending of various state and local foreclosure moratoria may have played a role in the year-over-year figures.
Overall, foreclosures are declining, with July at a 15-month low nationally, according to Black Knight data, although bank repossessions were up in the first half of 2023, according to ATTOM Data Solutions.


