

How hot is the housing market? There is certainly no shortage of indicators, but three in particular were published in the last week: the S&P/Case-Shiller Home Price Index, the All-Transactions House Price Index from the U.S. Federal Housing Finance Agency and the MSA-level “hotness” scores from Realtor.com.
The indices suggest high prices that are inching higher, while the hotness scores suggest northern MSAs are gaining ground over their southern counterparts.
Turning first to the price indices, the FHFA All-Transactions index is a weighted, repeat-sales index of single-family properties with mortgages purchased or securitized by Fannie Mae or Freddie Mac since 1975. In the index, the base year with an index value of 100 is the first quarter of 1980.
This quarterly index reached 645.18 in the second quarter of 2023, an all-time high, according to the latest data published Aug. 29. That is up 3.1% from the first quarter and up 4.5% from the year prior.
The S&P/Case-Shiller index also uses a repeat sales method, but is calculated monthly, seasonally adjusted and indexed to a base of January 2000.
Its all-time high came in June 2022 at 304.82, but this June – the most recent data – is right on its heels at 304.64. That is up only 0.7% from May and essentially flat to the year prior (because the Case-Shiller index lags, home sales that went into contract in April are present in the data).
The closest FHFA equivalent to the S&P/Case-Shiller index is its Purchase-Only House Price Index, which is likewise calculated monthly and seasonally adjusted. At 405.81, June constituted the index’s all-time high. It is up only 0.3% from May and up 3.1% year-to-year.
While these indices are climbing as of June, it should be noted that home prices have faced headwinds in the months since. Buyers are losing purchasing power to rising mortgage rates, mortgage demand has dipped and homebuilder confidence has declined, to name a few.
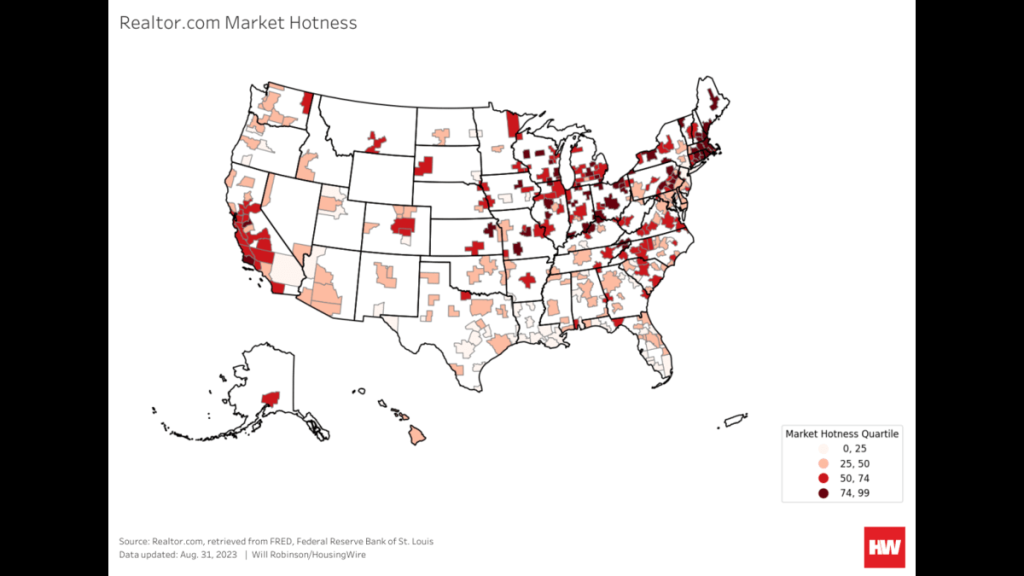
Turning to the Realtor.com hotness scores, this measure attempts to calculate each MSA’s standing compared to the nation’s other MSAs based on listings’ median days on market and average listing views on Realtor.com. It is a more timely view of these markets, with August as the most recent available data.
The hottest metros in Realtor.com’s rankings are located mostly in the North and the Midwest, while the lowest-ranking metros are mostly found in Louisiana, Texas and Florida.
The year-over-year change in each MSA’s market hotness score further shows a new preference for northern locales over southern ones. Several southern cities’ scores fell, while MSAs in the Midwest and Northeast, as well as California, saw noteworthy gains.


