In May, the Federal Housing Finance Agency’s U.S. Purchase-only House Price Index rose to a level on par with that observed in April 2006 on a seasonally adjusted basis, the latest chart in the Mortgage Bankers Association’s chart series showed.
Click to enlarge
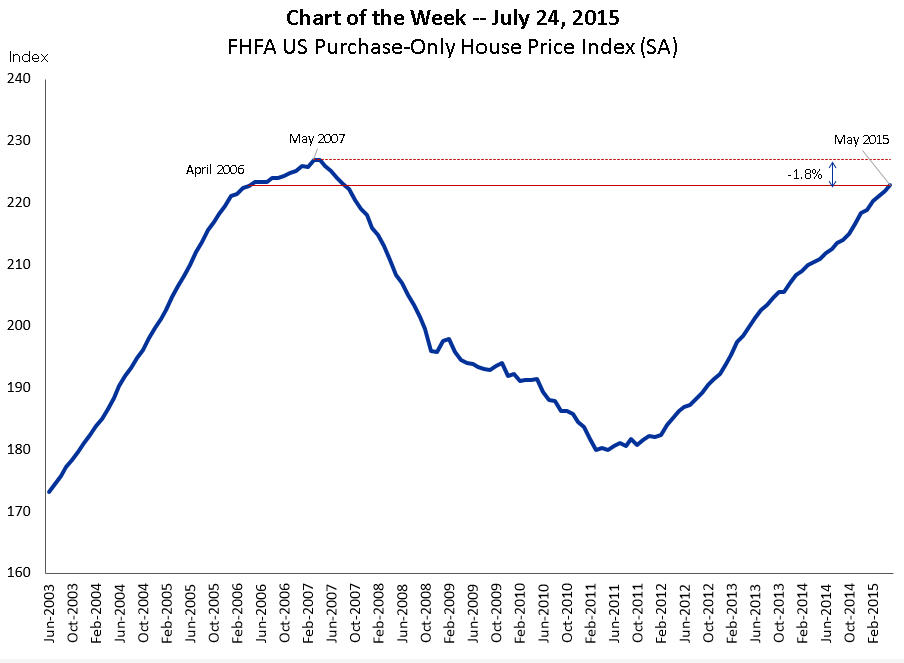
Source: MBA
The national index of house prices is now only 1.8% below the peak level of May 2007.
Broken up by the FHFA’s purchase-only regional indices, “The recovery has varied around the country,” the MBA said.
Relative to the peak, the regional prices indices range from 11% higher in the West South Central region, to 12.7% lower in the Pacific region.
“Continued increases in prices should reduce the number of households with negative equity, and increase mobility as it improves homeowner’s confidence and ability to ‘move up,’” the MBA stated.
“While affordability is a concern, in many places house prices have not yet recovered to their 2007 levels, while wages and salaries are now 16% higher according to the Employment Cost Index,” the report continued.

