


As recession talk becomes more prevalent, some people are concerned that mortgage credit lending will get much tighter. This typically happens in a recession, however, the notion that credit lending in America will collapse as it did from 2005 to 2008 couldn’t be more incorrect, as we haven’t had a credit boom in the period between 2008-2022.
One of the biggest reasons home sales crashed from their peak in 2005 was that the credit available to facilitate that boom in lending simply collapsed. So, could we see a similar tightening of credit when the next recession hits? The short (and long) answer is no, not a chance. When people say credit will collapse down to 2008 levels, I kind of snicker and think, well, we can’t collapse to 2008 levels because credit availability is already there.
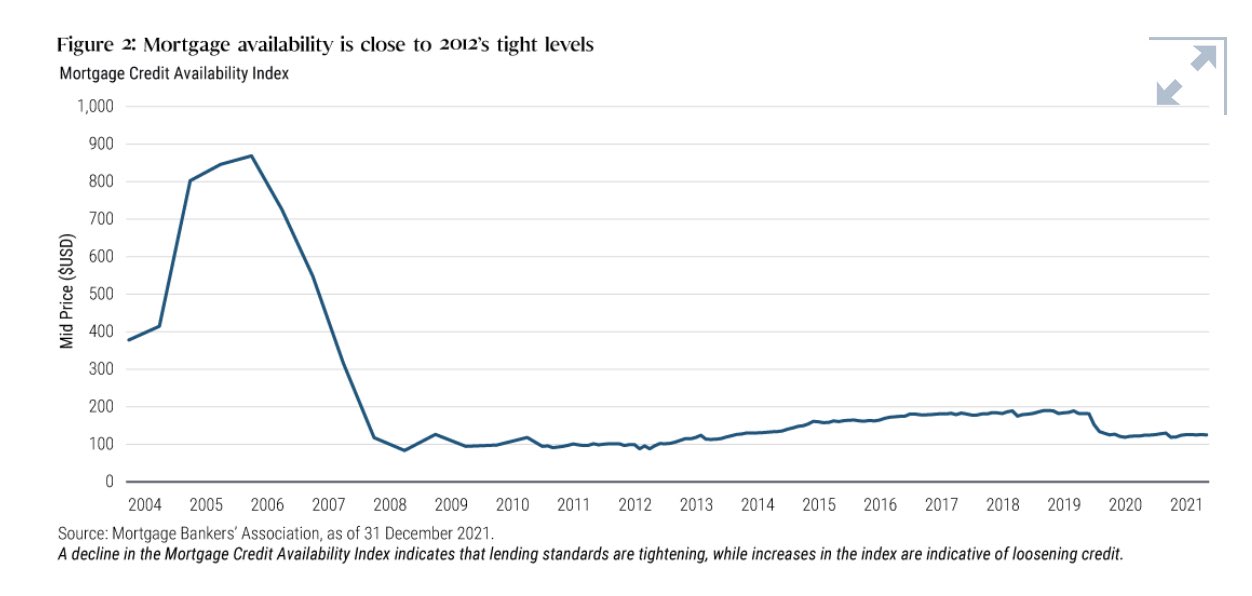
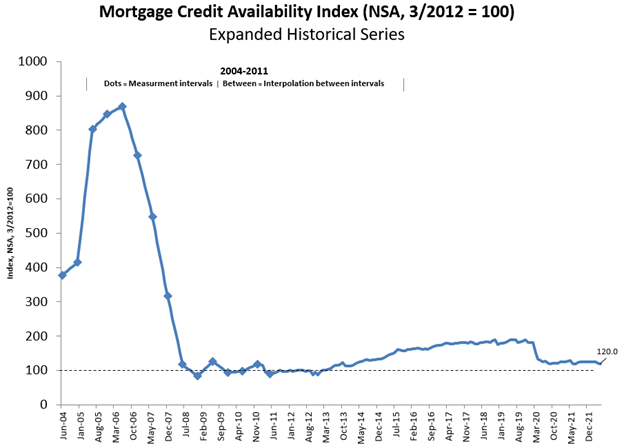
It really is that simple, folks. When people say credit will get so tight that we are headed back to 2008 levels of lending, they’re telling me they’ve never read the MBA’s mortgage credit availability index, not even one time. I don’t think it’s shocking that people have never seen this index dated from 2004-2021. First, most people don’t look for charts, that is only for nerds like me. Second, the people who keep saying housing credit will crash to 2008 levels don’t want to show you the chart that shows that this already happened — the grift wouldn’t work as well if they presented the facts.
I have been telling people for years that the tight lending narrative is more of an urban legend than reality. Yes, in theory, lending got much tighter from the peak during the housing bubble years to 2008, this fact can’t be disputed. However, the exotic loan debt structures that facilitated that index to rise back then are gone from the system and that is a good thing.
Millions and millions of Americans get home loans each year as qualified homebuyers, so I have always disputed the premise that tight lending is a real thing. We just lend to the capacity to own the debt, and the index is correct to stay low since 2008 because we can’t legally loosen up lending standards as happened from 2004-2005.
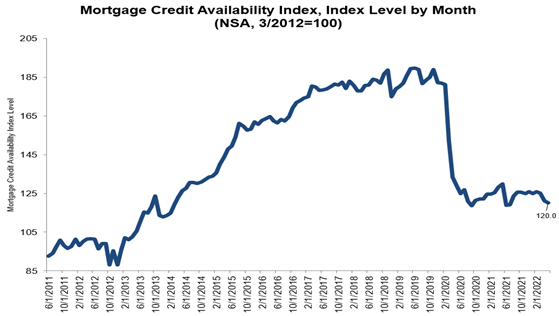
Let’s take a look at the credit availability index using the 2020-2022 period. Whenever a recession happens, credit should get tighter. This did occur in the mortgage industry after COVID-19, which was perfectly normal. We saw credit availability decline and some non-QM lenders stopped their business during COVID-19. We noticed some lenders tighten their credit standards, which didn’t last very long.
During the housing credit bubble, this index headed toward 900 to only collapse toward 100; that is a big freaking move, people. Why did that happen? Because the credit of the housing bubble years included exotic loan debt structures that were being taken off the marketplace because the lenders themselves were going out of business. The business model of lending based on exotic loan debt structures was going away, which means credit was collapsing at an accelerated rate.
Looking at 2020, we saw a move in this index, from 185 to 120. Let me repeat this, 185 to 120 isn’t anything near 900 falling to 100. When people tell you that mortgage credit availability will collapse to 2008 levels as lenders go out of business and lending will come to a halt, remember they haven’t read the data to know that we are already here, baby! From the MBA:
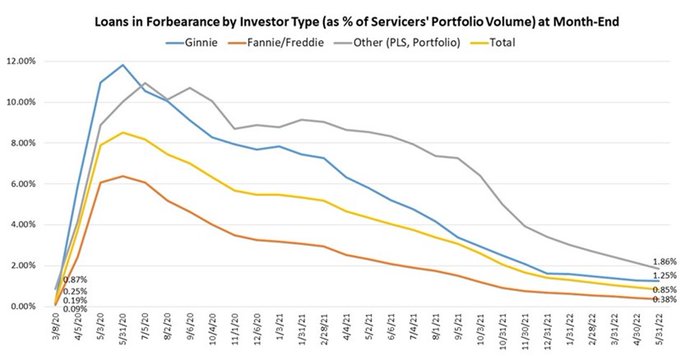
As you can see, not only didn’t lending collapse, but lending took off in the COVID period and people were buying homes and refinancing as if nothing was terribly wrong with credit availability. One of the best things during the crisis was that Freddie Mac and Fannie Mae weren’t publicly traded companies, so their stock prices didn’t collapse and credit didn’t get tight. They were able to lend and provide forbearance — which was a total victory for America and its people.
The loan profiles of American households looked great throughout this time period, so it’s no surprise that most people didn’t need forbearance. That has been a big talking point of mine since the summer of 2020 and guess what? Forbearance has collapsed from nearly 5 million loans to under 500,000. More and more people are still getting off forbearance each month. The percent of Fannie and Freddie-backed loans that are in forbearance is now down to 0.38%. Yes, that is a zero dot 38%.
From MBA:
Post-2010, lending in America has been pretty vanilla, just essential long-term fixed products with sensible underwriting. This was one of the reasons I didn’t think we could get to 300 on the MBA purchase application data until 2020-2024 when our household formation would grow into its peak first-time homebuyer age of 33. Ages 28-34 are the biggest in America today, so it shouldn’t have surprised anyone that housing held up in 2020 and 2021. Also, this is a big reason why rent inflation has been so strong. It’s not complicated: demographics = demand.
Regarding the demand, let’s look at the purchase application data. Since the summer of 2020, I’ve genuinely believed that once the 10-year yield breaks over 1.94%, the housing market could change, and with the home-price growth that we have had since 2020, the demand would be worse than usual. Well, the one thing I didn’t get right about this is that I was expecting a more significant impact on the purchase application data, and so far, I haven’t seen the levels of declines that I have scheduled for this data line this year.
On Wednesday, purchase application data showed a -4% week-to-week print, which breaks the three-week positive streak. The unadjusted week-to-week data was positive +7, but I don’t count the unadjusted data as it can be very wild on a week-to-week basis. The year-over-year data showed a -17% decline and -16.75% on the four-week moving average.
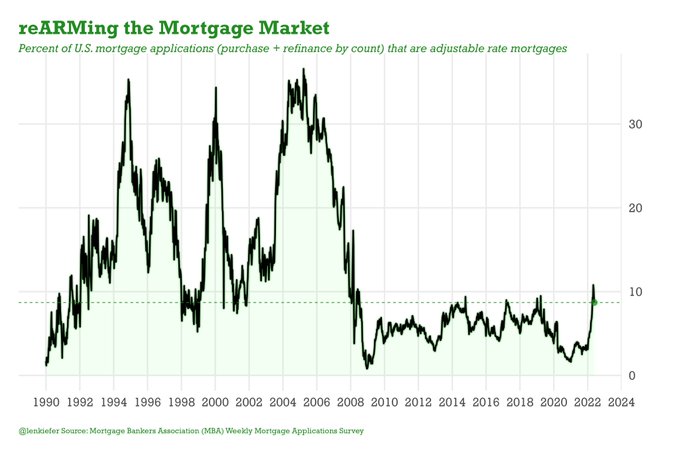
I was anticipating the four-week moving average decline to show at least 18%-22% on a year-over-year basis due to the massive affordability hit on housing this year. However, that hasn’t happened, and I believe that is mostly due to the rise in ARM loans, which mitigated the damage from higher mortgage rates.
From Freddie Mac:
As you can see below, purchase application data is below 2008 levels, and the credit availability index is roughly at 2008 levels today.
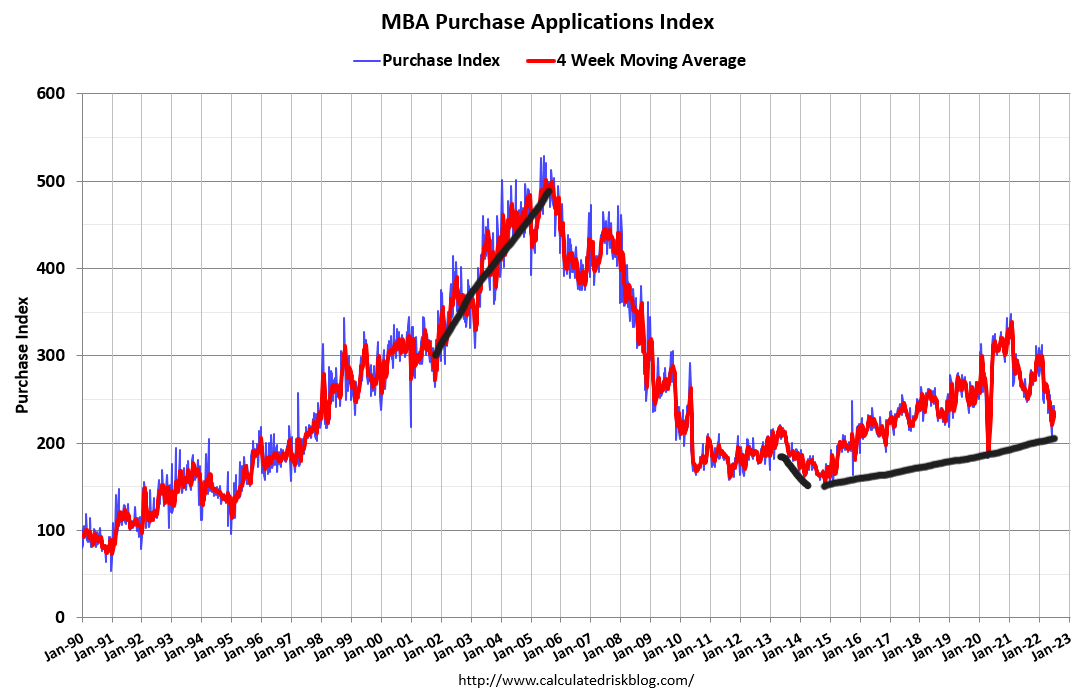
Look, no massive foreclosures are happening to send inventory skyrocketing. Why is this? Because credit got better post-2010, we can see credit availability declines from 2005-2008. We can’t see the purchase application data collapse as it did from 2005 to 2008 because we never saw a credit boom like we had from 2002-2005. The loans that facilitated that boom, which took the credit availability index to near 900, are no longer in the system since 2010.
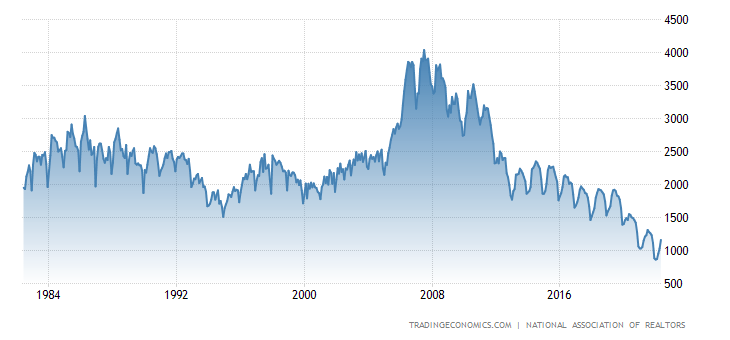
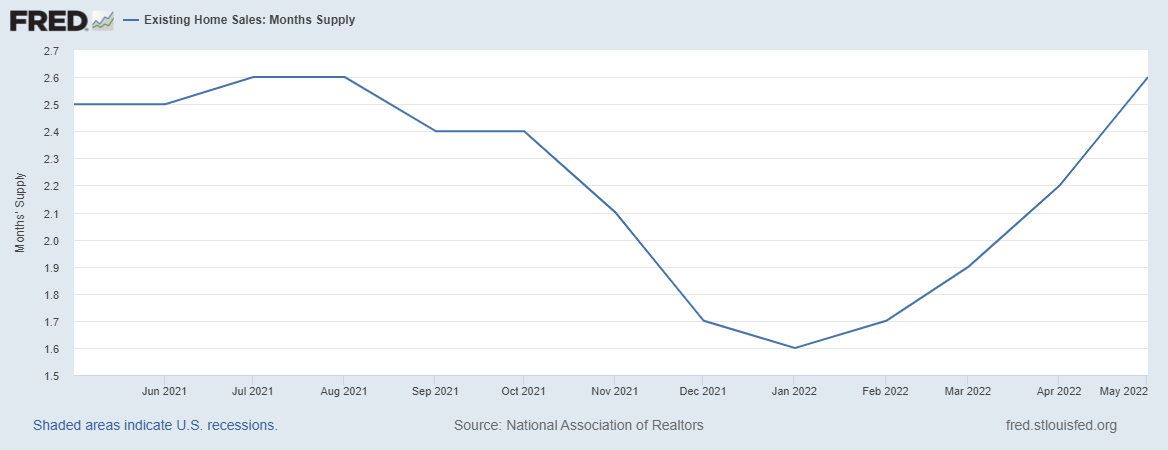
NAR Total Inventory Data from 1982-2022
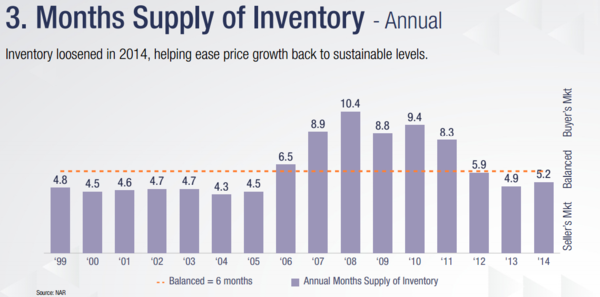
Currently, the monthly supply for the existing home sales market is 2.6 months. Far from the 10.4 months we saw in 2008.
When people say that mortgage lending will collapse to 2008 levels because all the nonbank lenders will go out of business, they clearly haven’t been tracking the credit availability index since 2008. We have plenty of nonbank and traditional banks that can lend to the American people, but the credit availability is limited always because we corrected the sins of the past.
The honest truth is that this isn’t much of a story, either way: credit can’t really get loose with the qualified mortgage laws in place nor can it really collapse. If Freddie and Fannie were publicly traded companies and their stocks were collapsing and the credit market was freezing up on them, that would be a concern. However, they’re not publicly traded companies.
One of the best things we have done in economics is that we made American lending great again by making it dull. What happens when you’re boring? You don’t get the hot spicy action we saw in credit from 2002-2005 and then an utter collapse in demand and credit as we saw from 2005-2008. This is a good thing, not a bad thing, and why I have made it a big part of my work over the last decade to talk about how we should never ease lending standards to get back to the levels we saw starting in 2004. I believe we will never make that mistake again.


Good explanation of where we are today vs 2008 situation. However, you haven’t addressed the possible increase in forbearances due to the government approved deferment of mortgage and rent payments during the pandemic. That period of time is just about coming up on the 6 month from the end of it when we may see an increase in inventory due to foreclosures. Are there statistics on this possibility?
I really appreciate the data and valuable insights in your articles. But the conditions present during the 2008 crash arent the only conditions that can lead to declines in housing prices. Itd be interesting if you looked at how real estate performed during other inflationary periods, such as the crash in the 80s, to see if theres any overlap from the further past with current conditions.
If you’re talking about prices declining, that is a different subject from what I was addressing with credit availability. I have written a model of what I need to see before I can talk about national home prices declining, not on real terms but in nominal terms.
This article goes into the subject with specific inventory channel data going back to the 1980s.
https://www.housingwire.com/articles/are-home-prices-about-to-fall/
Also, some more insight into that topic, since my 23% price growth model got smashed in 2 years, I need prices to fall back down 12%-18% to make my model work again before 2024.
This podcast interview with Atlos Research goes into more details about my thinking on why I believe inventory levels can grow even without a recession. It also goes into detail about the variables that can change that process.
https://www.youtube.com/watch?v=P7AeU_FycOA&t=2010s
Being part of a team with higher rates isn’t a prevalent stance, but I do explain my logic with that view.
Jennifer
Forbearance went from nearly 5,000,000 to under 500,000, and even yesterday, the Federal Reserve acknowledged that their internal data showed more people getting off Forbearance. We have foreclosures of vacant homes going back to the 2018 timeframe that is coming online again, and we should see an increase in the data on that part. However, since 30-day delinquency data just broke to all-time lows on the mortgage data, the velocity of inventory from old foreclosures coming on line is limited to pre-pandemic trends.
This article shows the credit stress data via a chart and how the foreclosure data is. Also, what happened from 2005-2008 was that people filed for foreclosures, bankruptcy in 2005, 2006, 2007, and 2008, then the recession of the job loss in 2008. The charts here show the difference
https://www.housingwire.com/articles/are-home-prices-about-to-fall/