

The 10-year yield and mortgage rates have been rising close to the 2023 high as some labor data shows that the honey badger labor market is still growing. To make things even more complicated, the spreads between the 30-year mortgage rate and the 10-year yield keep getting wider. The question is: will the labor data push mortgage rates to 8%?
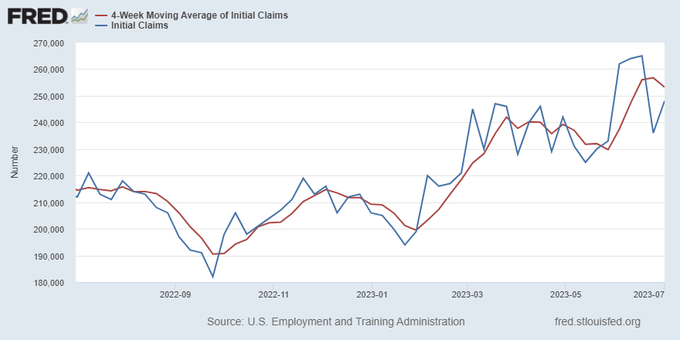
In my 2023 forecast, I wrote that if the economy stays firm, the 10-year yield range should be between 3.21% and 4.25%, equating to mortgage rates between 5.75% and 7.25%. As long as jobless claims trend below 323,000 on the four-week moving average, the labor market is holding steady, which means the economy remains healthy. As you can see in the chart below, the 10-year yield channel has stayed within my 2023 forecast range.
For the labor market to break, the four-week moving average on jobless claims needs to get above 323,000, but that number is only at 248,000. Jobless claims have been rising from the recent lows, but haven’t broken yet.
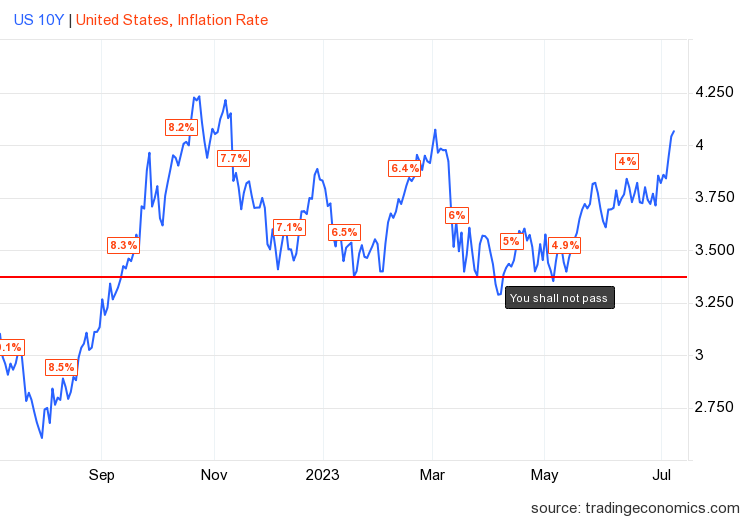
From the St. Louis Fed: Initial claims for unemployment insurance benefits increased by 12,000 in the week ended July 1, to 248,000. The four-week moving average fell, to 253,250.
Mortgage rates have stayed in line with my forecast this year, but the spreads have gotten worse. What factors could send mortgage rates toward 8%, which wasn’t part of my forecast? The first factor is the labor market, which is more important in 2023 than the inflation growth rate.
The labor market
Early in the COVID-19 recovery, I had three key talking points:
- We should get all the jobs back lost to COVID-19 by September 2022.
- Job openings should get to 10 million in this recovery.
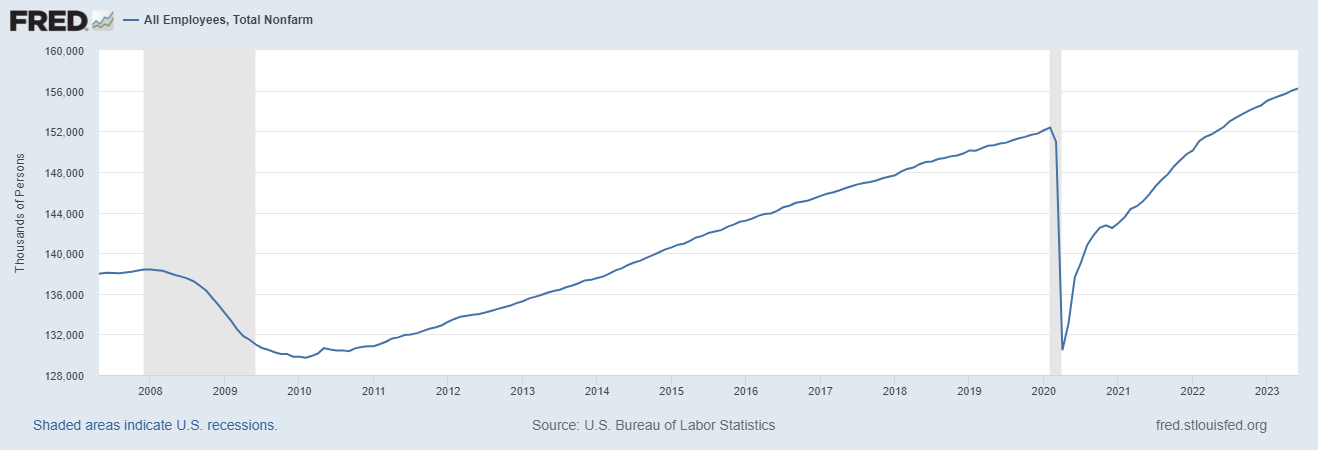
- If COVID-19 didn’t happen, taking trend growth from February 2020, we should be at 157 million to 159 million total workers employed (nonfarm payroll).
Here’s where those landed:
- We recovered all the jobs lost to COVID-19 by September 2022.
- Job openings are still high historically. While we are far below the peak number of job openings, this level is simply too high for the Fed to feel comfortable — they don’t fear a job loss recession when job openings are this high.
- However, with jobless claims and job openings data, we can see that the labor market isn’t as tight as it used to be.

The third factor is also key to understanding the labor dynamics: we are almost back to where we should have been all along with the total employment level of jobs in the U.S. Currently, we are at 156,214,000, so we’re getting closer to where job growth should be cooling down to our population growth realities.
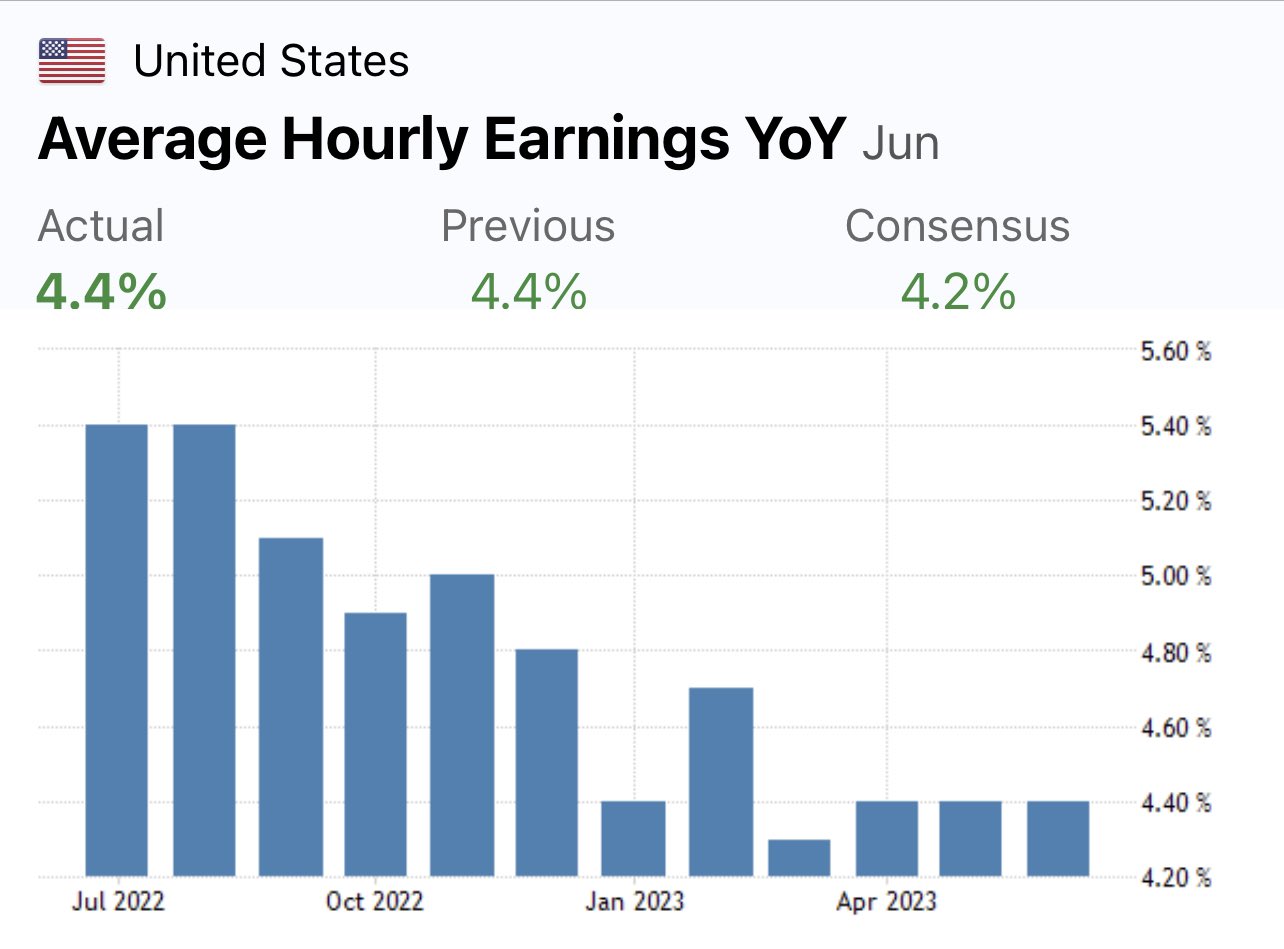
The job market should slow down as we get closer to that 157 million to 159 million level. Next is wage growth, which isn’t spiraling out of control as some people feared it would. The growth rate is still too hot for the Fed, so if they seem more hawkish, it’s because wage growth at 4.4% is too much for Americans. The Fed has to ensure you don’t make more money because of some desperate fear of 1970s-style inflation, which is unfounded.
Friday’s wage growth was hotter than anticipated but not spiraling higher out of control. Wage growth has been cooling off since January of 2022, all while the labor market was tight.
To get to 8% mortgage rates, my 10-year yield peak call for 2023 would have to be wrong, the economy would have to be stronger than any of us believe it to be, and the bond market would need to believe that too. So far, that has yet to happen. If you had to have first-world problems, this is the one you would want to have.
Let’s look at the job report.
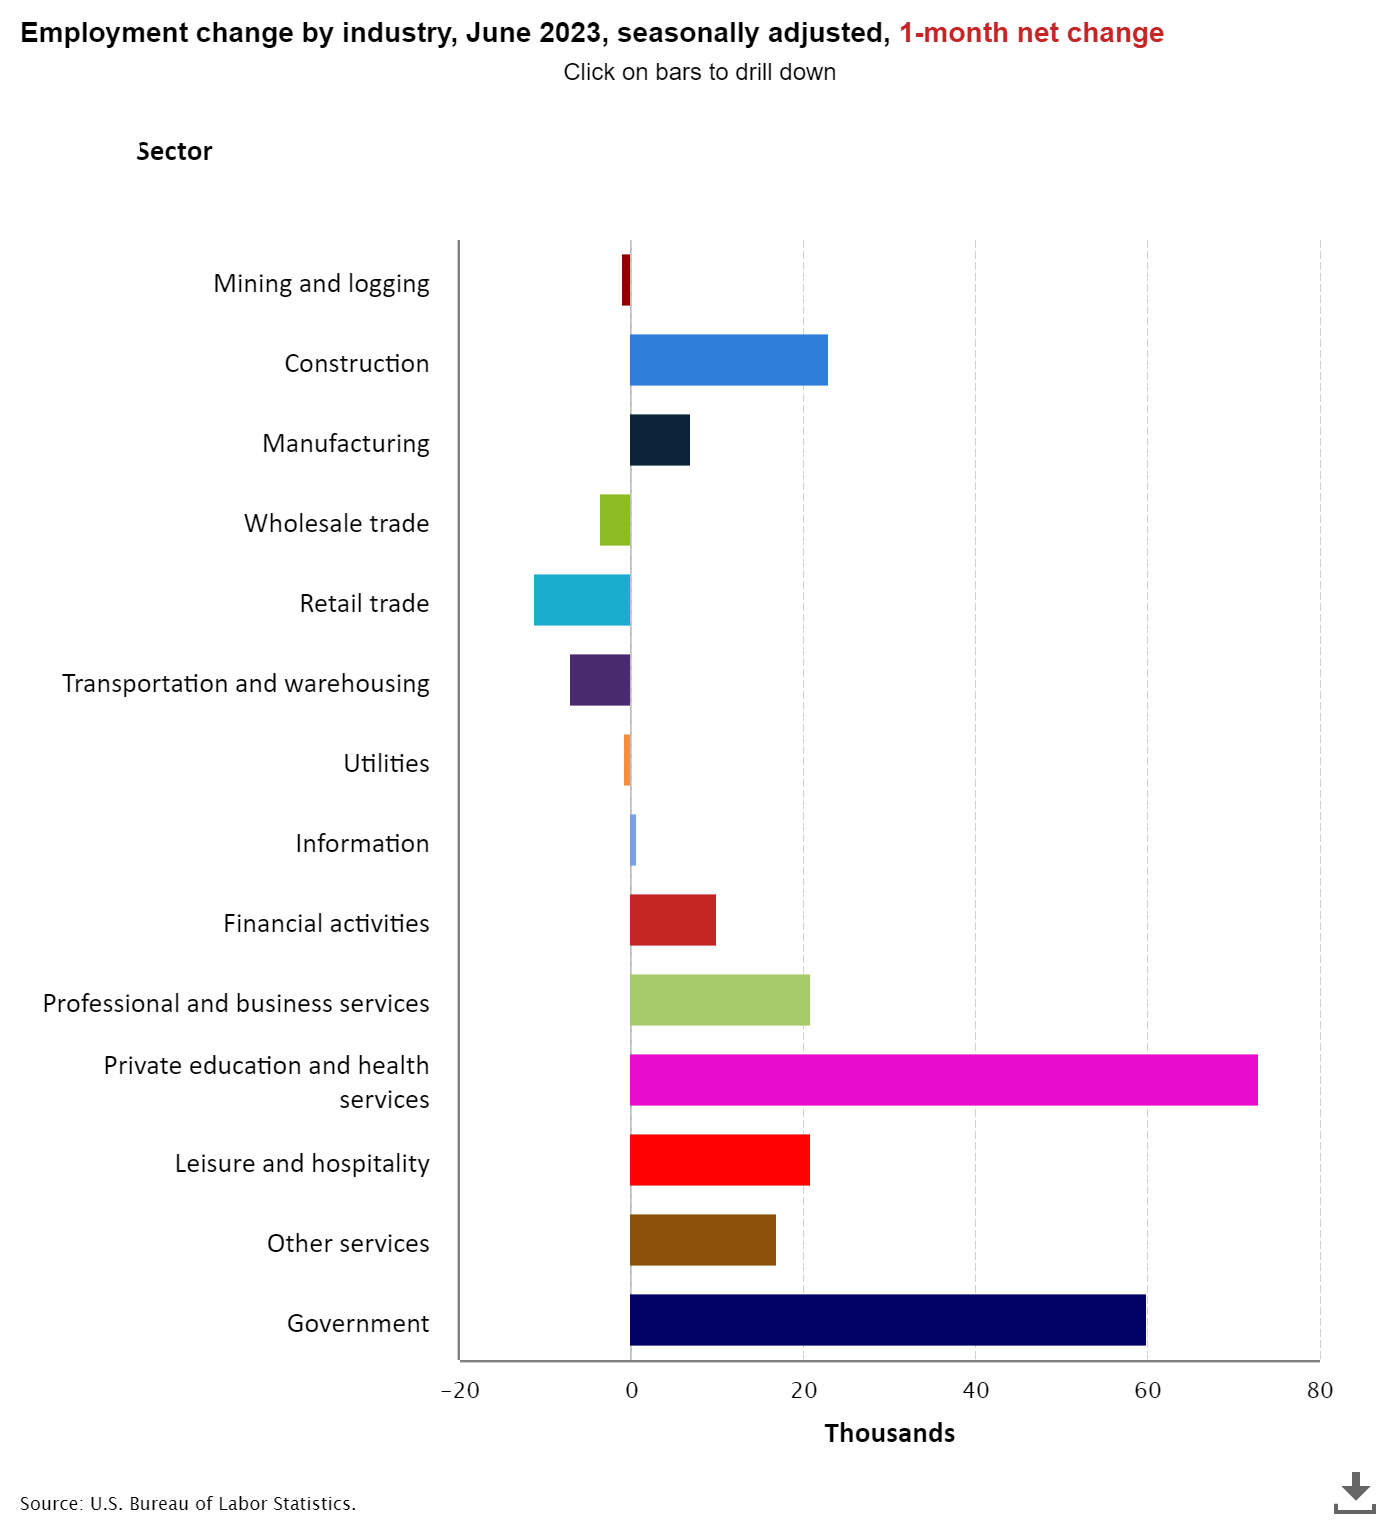
From BLS: Total nonfarm payroll employment increased by 209,000 in June, and the unemployment rate changed little at 3.6 percent, the U.S. Bureau of Labor Statistics reported today. Employment continued to trend up in government, health care, social assistance, and construction.
While the headline number was a miss for some people, it wasn’t a bad headline print, but the revisions were negative 110K, combined. As I mentioned above, we are getting closer to being done with the make-up demand in labor, which should mean the growth rate of jobs should be lower.
Below is the breakdown of where the jobs were created and lost. We did have an extensive report on the government jobs, which typically doesn’t have staying power, so the private labor data was weaker than the headline print.
Below is a breakdown of the education attainment and labor force above the age of 25. As usual, those who never finished high school tend to have the highest unemployment rate.
Less than a high school diploma: 6.0% (2 months ago, 5.4%)
- High school graduate and no college: 3.9%
- Some college or associate degree: 3.1%
- Bachelor’s degree or higher: 2.0%
Wage growth came in a bit hotter than expected, but wage growth is not spiraling out of control, not so much that we need to force a job loss recession. Also, we should not want to hope for the meager wage growth we saw in previous expansions either.


This is my case for why I don’t believe we should see 8% mortgage rates. I could be wrong for a short period — we could have a bond market sell-off due to the U.S. dollar getting much stronger for many reasons — but that hasn’t happened yet.
So far this year, the 10-year yield channel has held its course, and the big surprise of 2023 has been the spreads getting worse. I still believe that is the mortgage rate story for the year, as the 10-year yield hasn’t surprised me. But with that said, if the economy accelerates higher with faster growth and wage growth picks up with the labor data getting stronger, that is a viable pathway for 8% rates as the spreads might even worsen.
Let’s cross that bridge if that happens, but until then, we will continue to track the weekly housing data here.


I think its worth mentioning that some of the job growth and for that matter, wage growth, is due to the amount of the workforce retiring. Do retired works get calculated into the numbers?
ie. job numbers are NET of lay-offs, what about retired?