


Mortgage rates headed higher last week after the CPI inflation report, but now, with news of a wider war in the Middle East, should we expect even higher rates? Some argue that money will go into the safety of the bond market, while others say a wider war can lead to higher inflation and higher rates. The week ahead will answer some of those questions early on.
10-year yield and mortgage rates
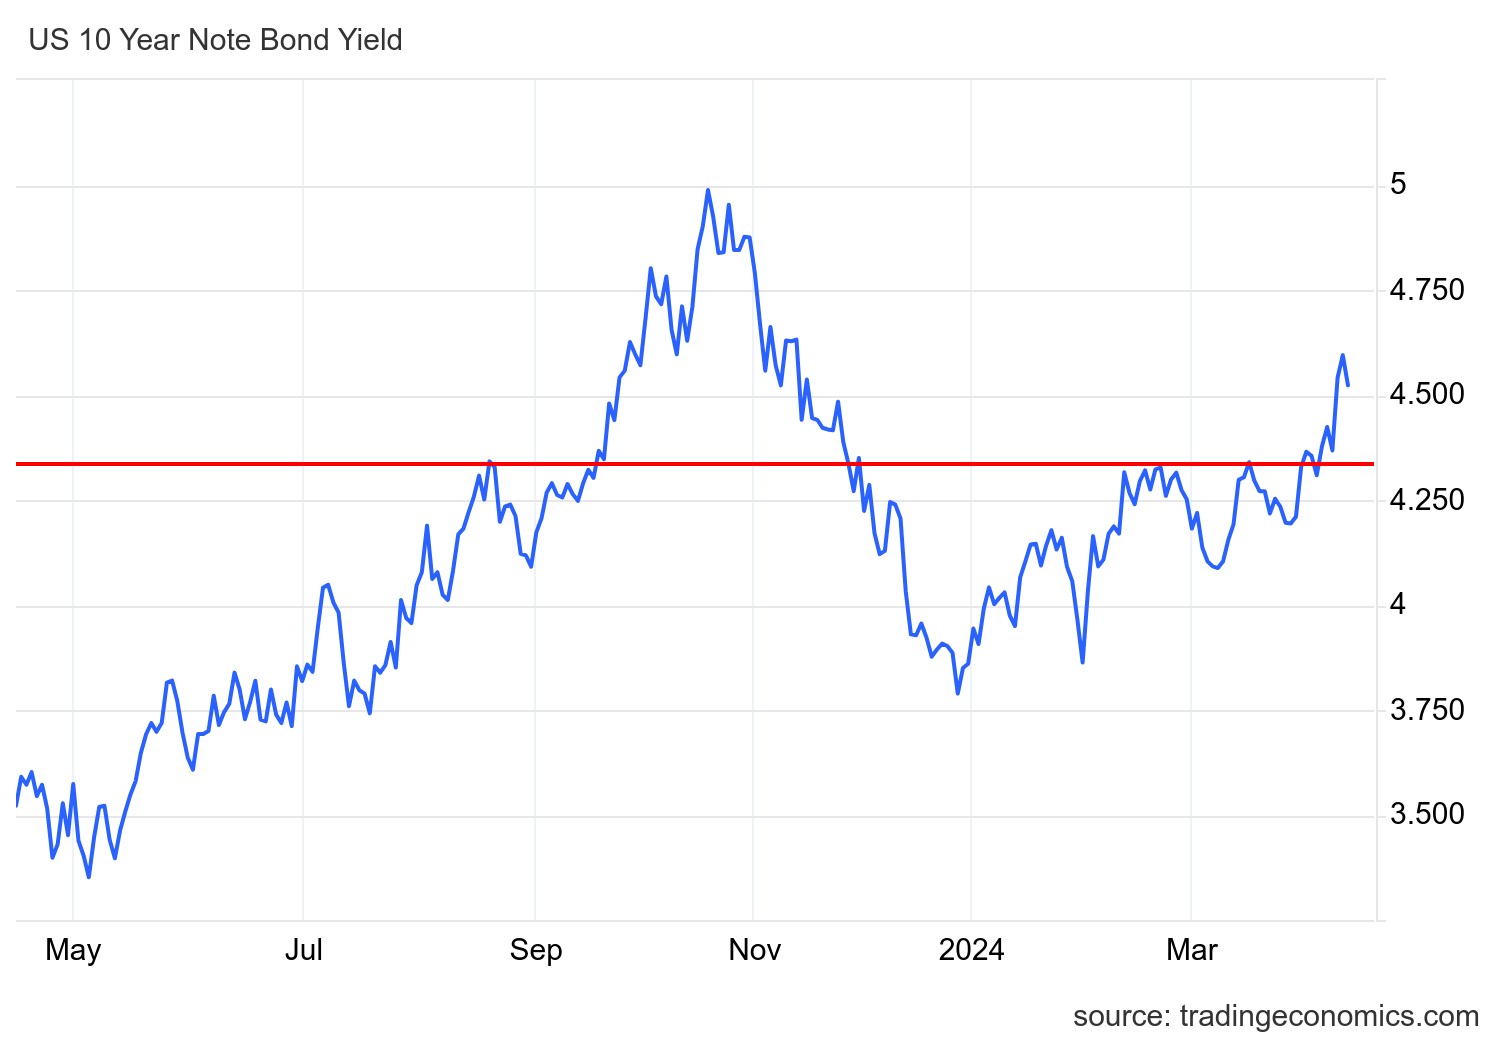
There is nothing good to report on mortgage rates from last week. The chart below shows that we broke the critical technical level on the 10-year yield (marked with a red line). The CPI data, which the Federal Reserve doesn’t track for its 2% target, came in 0.1% hotter than estimates, but that was good enough to take one mortgage rate cut off the table for now. I talked about this last week on the HousingWire Daily podcast.
Now that this technical level has been broken, 2024 is going to be a lot more interesting, something I discussed in an interview with Yahoo Finance.
Now, with the specter of a wider war in the Middle East as Iran launches strikes against Israel, what will the bond market do? Some will say that bonds rallied ahead of the pending war news on Friday, but we will get a better answer Sunday night with bond market trading.
One positive thing for mortgage rates is that spreads between the 30-year mortgage and the 10-year yield are improving. I believe these spreads became one of the bigger mortgage stories, as the banking crisis sent the spreads to new cycle highs. This data line is improving and for now, it mitigates the damage done by the higher 10-year yield.
Of course, if the spreads get better from here and bond yields fall again, then mortgage rates can act much better on the downside. This is something to watch for in the future.
Things are hapenning fast with mortgage rates, which is why I update HousingWire’s Mortgage Rate Center page with analysis every weekday morning — looking at how the bond market reacts to economic data or an event that can move rates.
Weekly housing inventory data
Usually, I would jump for joy at last week’s inventory growth. However, last week’s numbers don’t get a passing grade: The rebound impact of Easter boosted last week’s inventory data, just like it caused the inventory data to decline in the previous week.
One item to note for this year is the year-over-year comparisons on active inventory. Inventory bottomed out on April 14 last year, which was the longest time it took for the housing market to find a seasonal bottom ever. From now to the end of the year, the easy comps to show inventory growth are over. It will get more challenging to show more growth unless inventory starts to pick up, especially toward the end of 2024. However, with higher mortgage rates, we should see more inventory growth.
- Weekly inventory change (April 5-12): Inventory rose from 512,930 to 526,462
- The same week last year (April 7-14): Inventory fell from 411,577 to 406,600
- The all-time inventory bottom was in 2022 at 240,194
- The inventory peak for 2023 was 569,898
- For some context, active listings for this week in 2015 were 1,042,221
New listings data
It’s the same story with the new listing data; we got a nice snap-back from Easter. I am a big fan of the inventory growing year over year based on new listing data, and this is a big plus for the housing market. I had anticipated more growth, but as long as we are showing some growth this year, I will take that as a victory. Last year, it was savagely unhealthy that new listings data was trending at the lowest recorded levels.
- 2024: 66,786
- 2023: 48,556
- 2022: 67,229
Price-cut percentage
In an average year, one-third of all homes take a price cut; this is standard housing activity. When mortgage rates increase, demand falls and the price-cut percentage grows. That percentage falls when rates drop and demand improves.
This price-cut data line is critical to track now as inventory growth picks up for spring and mortgage rates have increased since the start of the year. Higher mortgage rates mean higher inventory growth and more price cuts, which keeps the model simple.
Here is the price-cut percentage for last week over the last several years:
- 2024: 32.1%
- 2023: 29.8%
- 2022: 18.8%
Purchase application data
Purchase applications dropped last week, down 5% week to week, but they showed a significant 23% decline year over year. The Easter holiday year-over-year comps have played a bit into this data line. We saw an excellent rebound in our pending contracts data last week and the inventory growth data from week to week. Now that Easter is out of the mix, we can move ahead on the week-to-week and year-over-year data with some more clarity.
Since November 2023, when mortgage rates started to fall, we have had 10 positive prints versus seven negative prints and two flat prints week-to-week. Year to date, we have had four positive prints, seven negative prints, and two flat prints.
The week ahead: War, retail sales and housing data
Do mortgage rates move with war news? Yes, they often do. Some speculate that in a war, money goes into the bond market as a flight to safety, pushing rates lower. However, war can also lead to higher inflation and higher mortgage rates. I discussed the economics of conflicts tied to mortgage rates as a premise for double-digit mortgage rates on this recent HousingWire Daily podcast.
This week, we will see how the bond and stock markets react to the news from the Middle East. We will also get retail sales numbers, which have been holding up better than most had anticipated for some time now. Also, we’ll get a ton of housing data, including the builders confidence, housing starts and existing home sales.


