


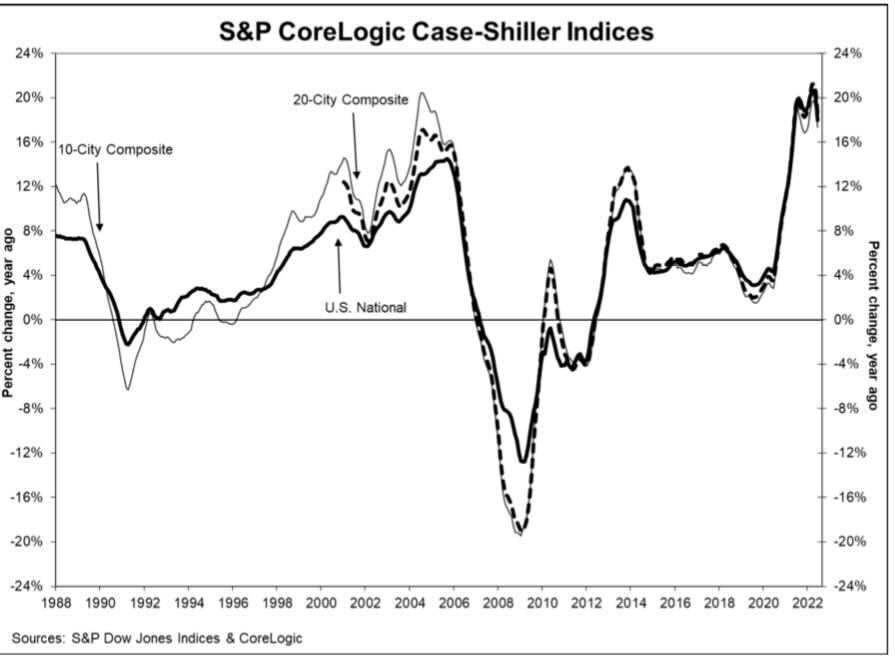
On Tuesday, the S&P CoreLogic Case Shiller Index reported that national home prices grew 18% year over year. While the growth rate is cooling monthly, we are still in a savagely unhhealthy housing market trying to get national inventory levels back to pre-COVID-19 levels.
From the index:
I know it seems strange, but existing home sales are falling, and the monthly supply of new homes is at 10.9 months even if the last existing home sales report showed home price growth of near 11% year over year.
There is a simple explanation for this, but you’re going to have to believe that supply and demand economics still work and that the credit profiles of homeowners matter more than people think. This means all those men and women since 2012 who have been saying its housing 2008 all over again on their YouTube, Twitter, Facebook and other social media outlets simply don’t have the proper training to talk about housing economics. I have documented the history of these housing price crash addicts for a decade now.
Housing inventory issue with no booming demand
My observation post-2020 is that many people have never read the total housing inventory data because we still have people who say active listings aren’t low or that it’s fake news. I understand why anti-Central Bank people say this because they want to blame everything on the Federal Reserve and say it’s just been booming demand.
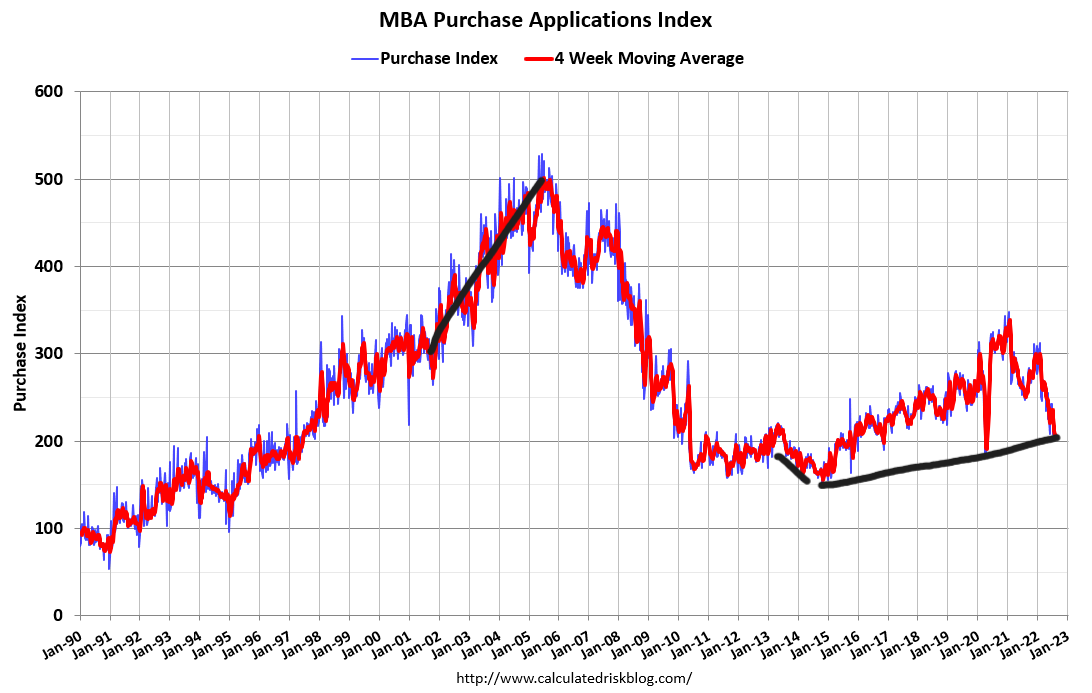
However, we haven’t had a credit sales boom like the one we saw from 2002-2005. Nor can we ever have a credit sales boom again with lending standards back to normal. Case in point, purchase application data is already below 2008 levels today.
Total Inventory had been growing from 2001-2005; total listings data in 2005 was at the higher historical range of 2.5 million listings. We broke to all-time lows post-2020, continuing the trend of lower inventory. Today, we stand at 1,310,000 active listings.
NAR Total Listing Data:
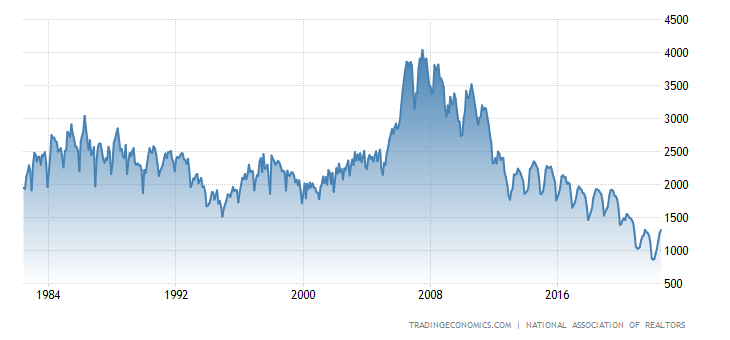
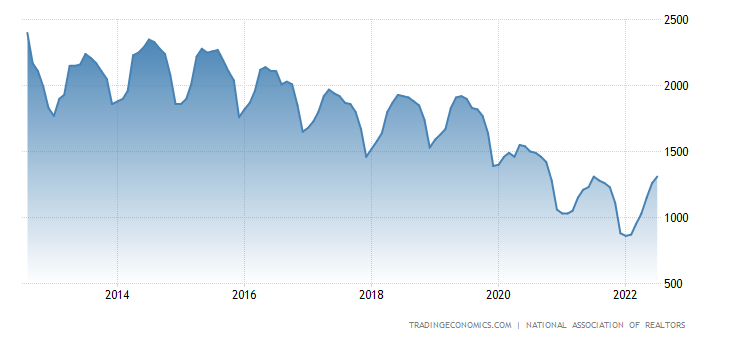
If we cut the timeline to the last time inventory grew, which was 2014, you can see this downtrend in inventory, unlike 2001-2005, when inventory grew from 2 million to 2.5 million. Inventory has been falling for years but people ignored the trend because some were always talking about the housing bubble 2.0 crash, especially from 2012-2019.
Then we can see a vicious break to all-time lows in 2020 when we didn’t have a seasonal push in inventory, and even today, with the weakness in home sales, we aren’t back to the range I believe would be ok, between 1.52-1.93 million. I don’t need to see total active listing get back to the historical range of 2-2.5 million to take the savagely unhealthy theme off, but I do need us to get into a range between 1.52-1.93 million, like I have talked about for some time now.
New listings are declining now
One of the issues with existing home inventory has been that, for the most part, a traditional seller is usually a buyer of a home. I am not talking about investors; I am talking about primary resident homeowners. Some sell to rent, of course. However, traditionally speaking, they buy a home.
One of the points of concern this year has been that when rates got toward 6%, this could potentially have new listings decline faster than normal because buying a home after selling might not be the best financial decision. Inventory is always seasonal, but the decline in new listings this year was not what I wanted to see. The decrease also happened when rates fell 1.25% from the recent highs of 6.25% back down to 5%. This is not encouraging news at all, in my view.
From Redfin
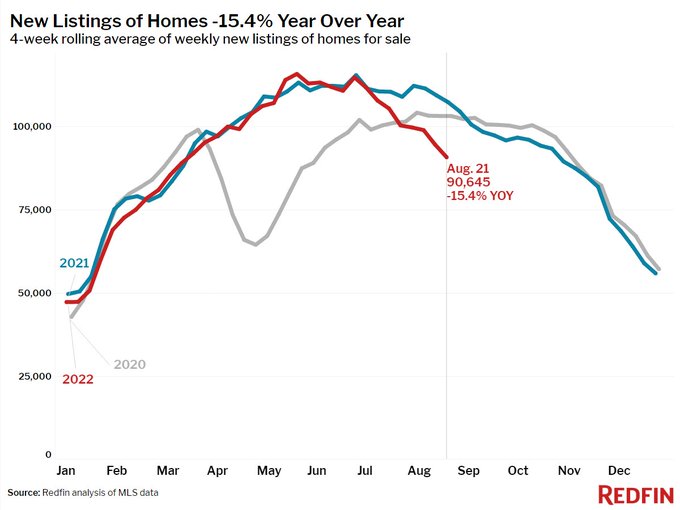
The recent decline in new listings has impacted the active listings to be negative now year to date. From Realtor.com:
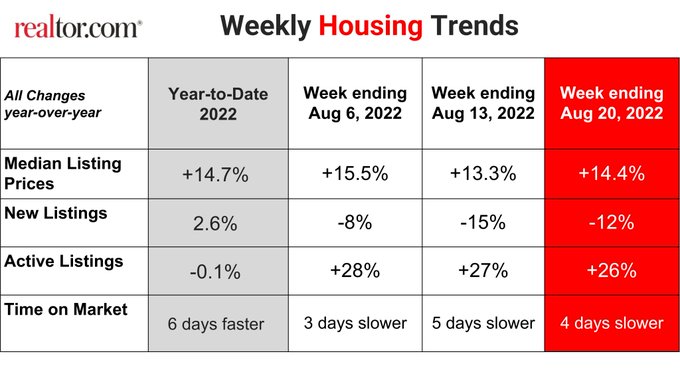
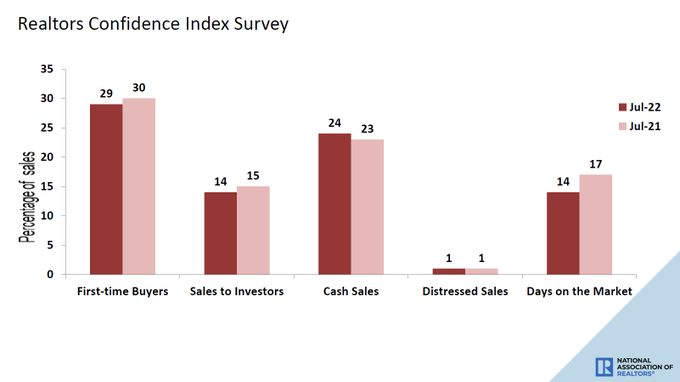
Even with demand weakness in recent months, days on market are still low.
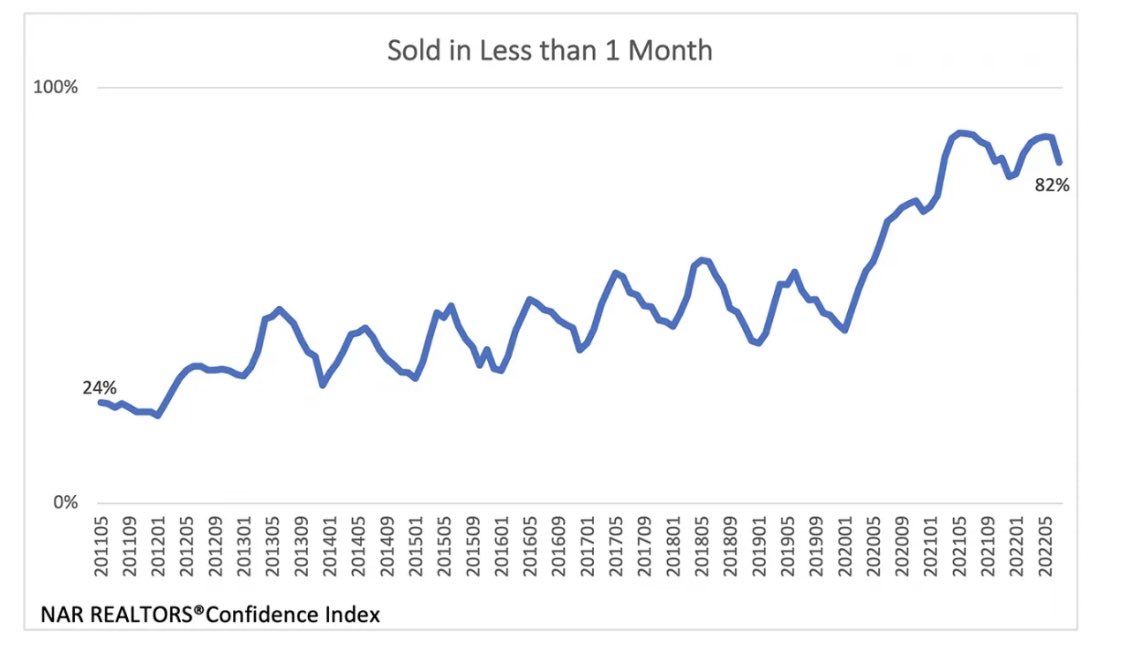
This is the most frustrating aspect of housing and the inventory situation. Because total inventory data is still low historically, the days on the market are not growing, year over year, per the last two existing home sales reports. NAR has a very critical data line, which shows that 82% of the active listings are being sold within a month. This is a much higher percentage than what we saw pre-COVID-19. This is also the most recent data, so the decline in sales still hasn’t increased the total inventory levels high enough to get back to pre-COVID-19 levels.
From the NAR:
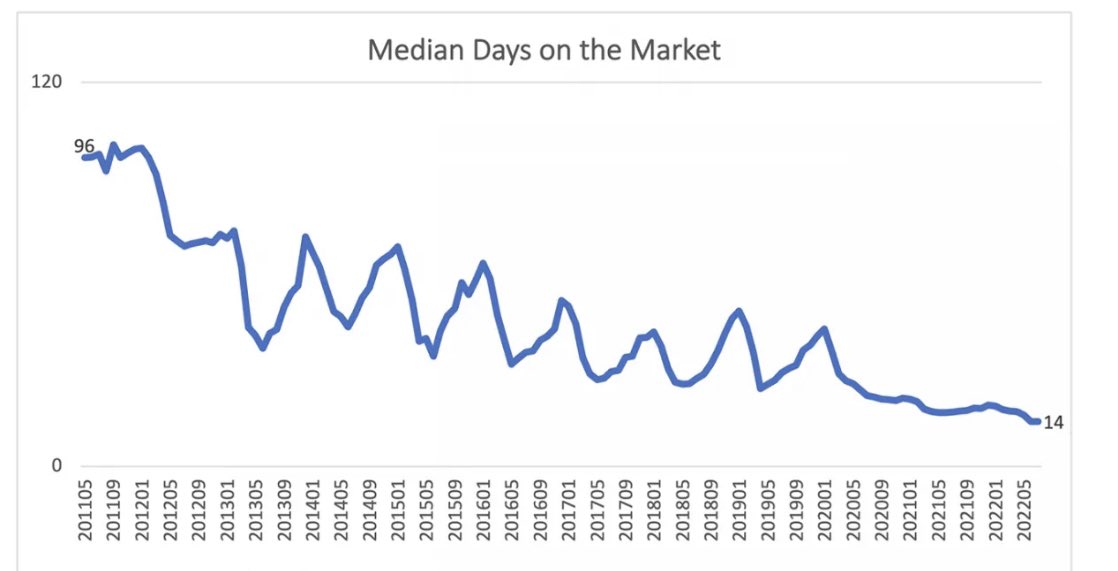
In the last existing home sales report, you can see the year-over-year decline on the days on market data.
In the early 1980s we had a significant sales decline from 4 million to 2 million, but we had more active listings then. In 2022, despite our robust sales declines, we are still seeing low days on the market because total active listings are still lower today than then.
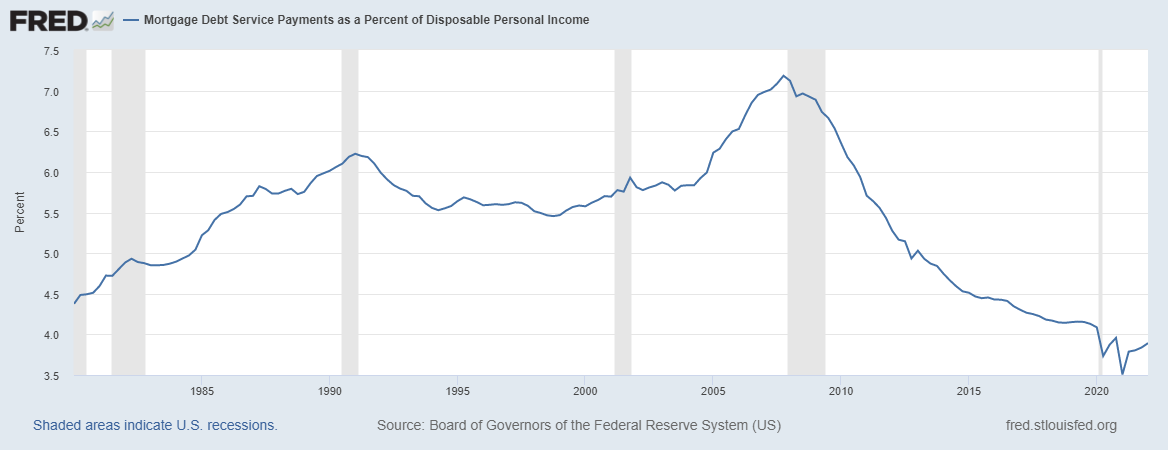
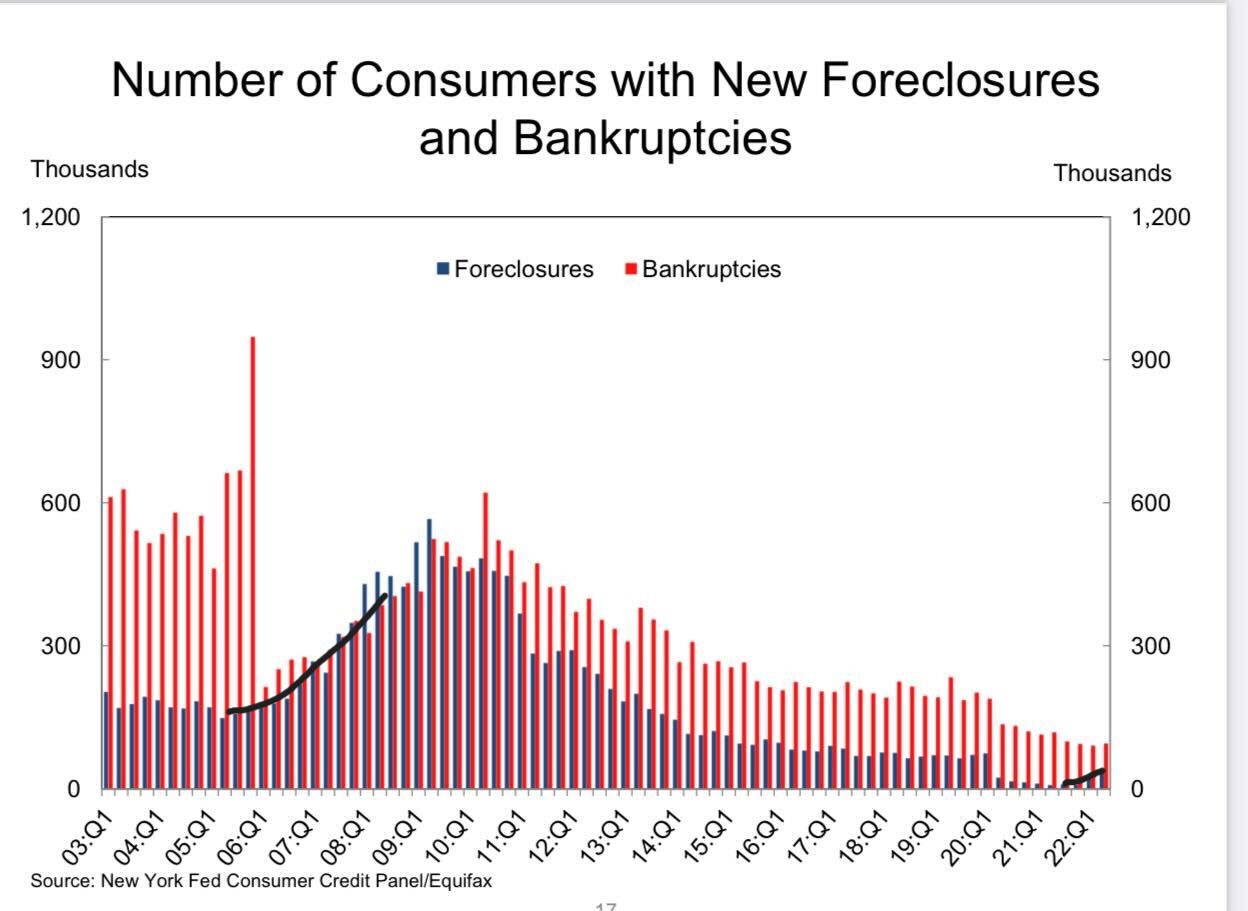
Also, homeowners on paper look great with fixed long-term debt products and have positive cash flow, so owners need a valid reason to sell. The next job loss recession, when it happens, will have more foreclosures, short sales, and bankruptcies. However, not to the degree we saw from 2005-2008. The 2005 bankruptcy reform laws and the 2010 Qualified Mortgage laws, once passed, created an expansion that has produced the highest quality homeowners in our lifetime.
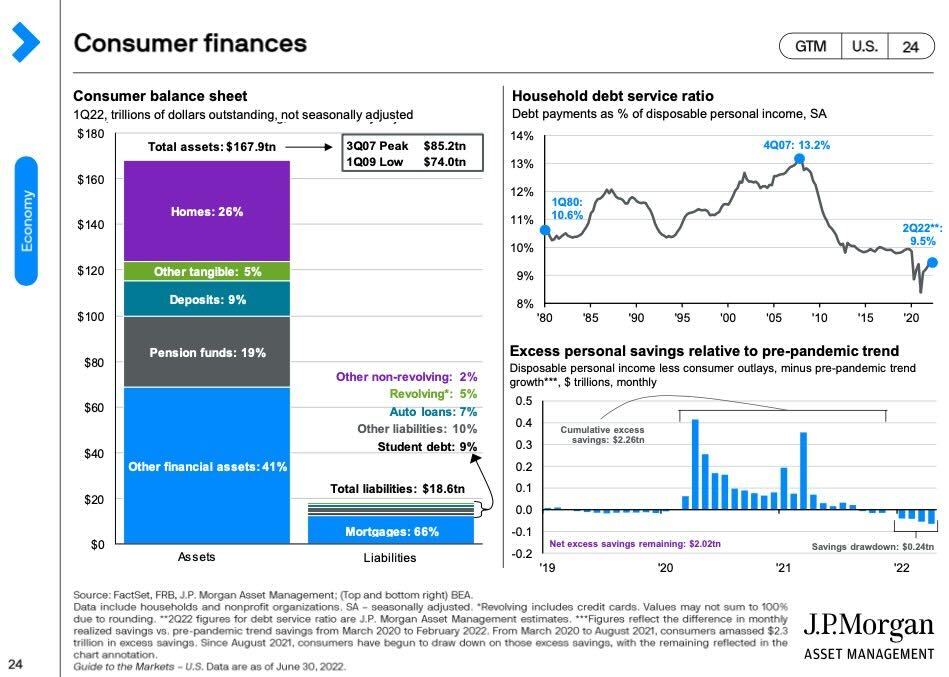
Note: Even with the savings rate percentage below pre-COVID-19 levels, we still have net excess savings of over 2 trillion dollars.
With housing tenure much longer post-2008, people’s wages have increased yearly, and their cash flow has improved with multiple refinancing since 2012.
Since we never had any exotic loan debt products in the system post-2010, you don’t see foreclosures and bankruptcies rising even as the expansion was moving along like what we saw in 2005, 2006, 2007 and 2008.
To wrap it up, inventory started the year at all-time lows, which is the most significant reason pricing is still firm even this late in the year. The growth rate of pricing above 20% wasn’t sustainable, and I and others are rooting for this madness to stop. However, there is a proper way to talk about and price cooling market other than saying 2008 every day of your life.
As I have stressed, people need to be patient with inventory growth and not run 2002-2011 credit sales to inventory models for this marketplace. It hasn’t worked since 2012 for a reason. Weakness in demand can create inventory, but it takes time because each new year we have new traditional listings.
Since we are so close to the fall, it’s time to look at housing with a 2023 outlook because seasonality will kick in soon. The growth rate of home prices is already cooling off, and the Case Shiller report lags that data, just like in October of 2020 when prices started to rise, but the data back then lagged the price growth.
I am all for price growth to fall and decline to get my price growth model back in line. As any analyst will tell you, you can’t just give up tracking data and throw up a random percent decline number and then hope that happens. Any good analyst will account for all the variables around the sector they follow. This is why I take the economic data one day at a time and stress that inventory growth needs more weakness and time.
I know the popular theme in 2021 was that we were going to see mass selling from homeowners who wanted to get out of their homes before prices crashed. This of course didn’t happen, but for me personally, something more problematic is happening right now. New listing data has fallen so much in the last seven weeks that it’s impacting the active listing data year to date, making it go slightly negative according to Realtor.com data. This isn’t what I wanted to see happen because it keeps the housing market stuck in a savagely unhealthy state.
We’re covering this important topic at our HousingWire Annual event Oct. 3-5 where Logan is a featured speaker. Register here to join us in Scottsdale, Arizona.


Great article. Thank you for covering the bases with analysis based upon data. People need this, not the headlines they see via media or YouTubers.
Eric, the business model of housing crashing, has been here for ten years now; it’s too juicy for people to pass up. People like myself who care about data are pilgrims in an unholy land.