


Tracking housing inventory this summer is like watching a zombie slowly walking on the beach. Last week inventory growth dropped and new listing data declined again. Strong labor data pushed up mortgage rates and purchase applications fell week to week.
- Weekly active listings rose by only 4,988
- Mortgage rates rose from 6.99% to 7.12% before ending the week at 7.04%
- Purchase apps were down 3% from week to week
Weekly housing inventory
For spring and summer, I wanted to see at least a few weeks where active listing grew by 11,000-17,000, which hasn’t happened recently. Two weeks ago we had some good movement with active listings growing almost 9,000, but last week that fell to just 4,988, and new listings data also fell.
- Weekly inventory change (July 21-July 28): Inventory rose from 479,273 to 484,599
- Same week last year (July 22-July 29): Inventory rose from 525,548 to 538,908
- The inventory bottom for 2022 was 240,194
- The inventory peak for 2023 so far is 484,599
- For context, active listings for this week in 2015 were 1,207,493
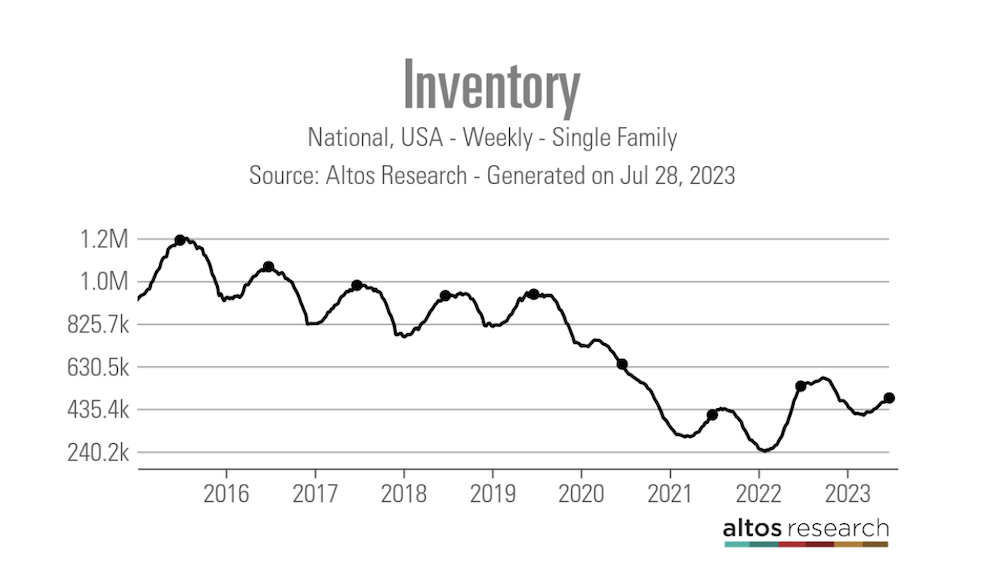
As we can see below, housing inventory is growing at a slower pace this year, and active listings are now negative year over year versus 2022 levels.
More people tend to list their homes in the spring and summer months, which is why we need inventory to gain some traction before it hits a natural seasonal decline. Instead, new listings data had a small decline last week. As the chart below shows, new listing data has been trending below 2021 and 2022 levels for some time now and is trending at the lowest levels ever.

Here’s how new listings compares to the past few years:
- 2023: 62,478
- 2022: 74,076
- 2021: 81,053

The 10-year yield and mortgage rates
Last week we got another strong jobless claims report, which sent bond yields and mortgage rates higher (it wasn’t about the Fed raising rates). Also, the Bank of Japan raised the target for a line in the sand with their 10-year yield from 0.50% to 1.00, sending bond yields rising overnight. However, even with all that drama last week, we ended below 4% on the 10-year yield, and mortgage rates ranged from 6.99% to 7.12%.

In my 2023 forecast, I said that if the economy stays firm, the 10-year yield range should be between 3.21% and 4.25%, equating to mortgage rates between 5.75% and 7.25%. I believe the only way we get below 3.21% on the 10-year yield is for the labor market to break, and that would require jobless claims to get over 323,000 on the four-week moving average, which hasn’t happened. The economy has stayed firm, and jobless claims have been falling, not rising lately.
From the St. Louis Fed: Initial claims for unemployment insurance benefits declined by 7,000 in the week ended July 22 to 221,000. The four-week moving average also fell to 233,750.
Seeing the jobless claims data, you can understand why the 10-year yield is in the upper portion of the forecast range for 2023 and why mortgage rates are still above 7%.


Purchase application data
Purchase application data was down 3% weekly, making the count year-to-date at 14 positive and 14 negative prints. If we start from Nov. 9, 2022, it’s been 21 positive prints versus 14 negative prints. However, since the middle of May, as mortgage rates have been near or above 7%, we have had more negative purchase application data prints than positive.
Even so, we aren’t seeing the big year-over-year declines we saw last year, primarily because we are working from historically low levels today. The fact that purchase application data isn’t collapsing like last year is why inventory is growing slower in 2023.

The week ahead: It’s jobs week!
We have a big week with labor data, job openings, the ADP report, jobless claims and the big one on Friday: the BLS jobs report! With the 10-year yield close to 4%, it will be a critical week for the bond market. If the labor data shows wage growth cooling down and being less tight, that can be very helpful for the bond market to head lower and drive down mortgage rates.
The housing market doesn’t need a week of hotter-than-expected labor data that might spook the Fed. Also, since we are getting closer toward the end of summer, it will be key to see at what point active housing inventory starts its seasonal decline.


