
The days on market are back to a teenager level in the existing home sales market, which means I can officially say we are back to a savagely unhealthy housing market! Just when I thought I was out, they pull me back in.
What do I mean by savagely unhealthy?
One of the critical data lines I track is the days on market, and when that breaks under 30 days it’s a dangerous sign, but when we get into the teenager level or lower, it’s a red alert. Nothing good happens in the housing market when the days on market are at a teenager level or lower. You either have a massive credit boom that will eventually lead to a bust, or you have too many people chasing too few homes. This is what leads to a savagely unhealthy housing market.
I first used the term savagely unhealthy in March of 2022 because we had solid demand while inventory was at all-time lows. Credit channels and inventory channels both changed after 2010 because of the qualified mortgage laws and the 2005 bankruptcy reform laws. This means you will see less financially stressed homeowners needing to sell their homes before a job-loss recession. This kind of activity was happening years before the job-loss recession happened in 2008.
Homeowners were in excellent shape before COVID-19 hit us, and they got better after refinancing their most significant debt to a lower payment. Also, their wages are rising faster in an inflationary period. I feared that housing inventory levels could stay abnormally low for longer, leading to unhealthy home-price growth and that’s what happened in the years 2020-2023.
Massive home-price gains aren’t good, especially when they happen quickly. Once mortgage rates rise in this environment, it can lead to big-time demand destruction, which is what has happened.
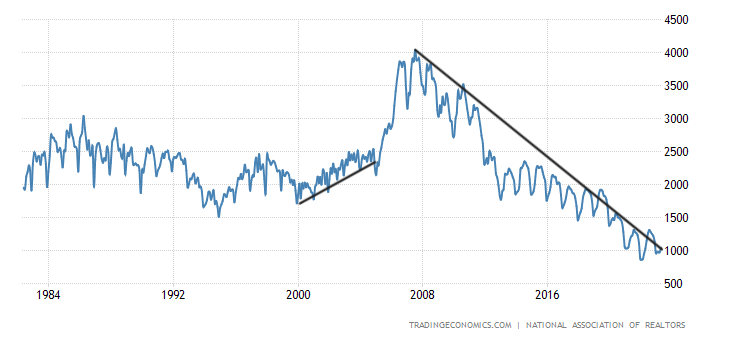
Existing home sales are near 21st-century lows, but even with that reality, as the chart below shows, we are still at teenager levels for the days on market.
From NAR: Total existing-home sales– completed transactions that include single-family homes, townhomes, condominiums and co-ops – rose 0.2% from April to a seasonally adjusted annual rate of 4.30 million in May. Year-over-year, sales dropped 20.4% (down from 5.40 million in May 2022).

Home sales came in better than I thought this month, as I was looking for a decline month to month. We had a giant sales print three months ago, which I believe will be the sales peak this year. So far, that call has been right because I don’t think mortgage rates can get low enough to boost demand higher from that print.
NAR Research: Total existing-home sales rose 0.2% from April to a seasonally adjusted annual rate of 4.30 million in May.

For the rest of the year, we want to play the edges of the sales range. The sales range should be between 4 million to 4.6 million, the same range I talked about after the giant sales print that took us to 4,550,000. Demand is undoubtedly weakening if we trend below 4 million but trending above 4.6 million would mean much better mortgage demand.
I don’t see anything in the data to get us over 4.6 million with duration unless mortgage rates fall much lower than where they are currently. There is a better case that we can get below 4 million if mortgage rates stay high and new listing data starts its seasonal decline in the data.
Now for the savagely unhealthy part of the report.
NAR Research: First-time buyers were responsible for 28% of sales in May; Individual investors purchased 15% of homes; All-cash sales accounted for 25% of transactions; Distressed sales represented 2% of sales; Properties typically remained on the market for 18 days.

We are close to the 2022 levels for days on the market, not because demand is booming but because it has stabilized. As the year progressed into the second half of 2022, housing demand worsened, and the days on the market grew above 30 days, meaning it was no longer a savagely unhealthy housing market.
However, as demand has stabilized, the days on the market have decreased.
Not much can be done here, mortgage rates are near 7%, and people aren’t selling. So when demand stabilizes, it can bring down the days on the market. The cash buyer percentage is the same year over year and roughly everything in this survey isn’t too far off 2022 levels.
From NAR: Total housing inventory registered at the end of May was 1.08 million units, up 3.8% from April but down 6.1% from one year ago (1.15 million). Unsold inventory sits at a 3.0-month supply at the current sales pace, up from 2.9 months in April and 2.6 months in May 2022.
Yes, housing inventory is down year over year. While inventory grew month to month, this year has been the walking dead on the spring inventory data, so the growth has been so bad that we had a negative year-over-year print in June! I can’t stress enough how bad that is, something I talked about on CNBC a month ago.
As you can see in the chart below, even with the single biggest crash in home sales ever recorded in history in 2022, total inventory data is still far from the historically normal levels between 2-2.5 million.
NAR total active inventory going back to 1982:
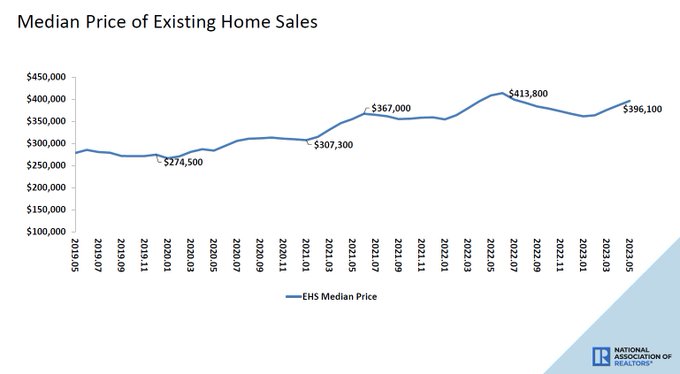
The existing home sales report surprised me on the demand side just a tad. However, the key for me is that the days on market data line turned housing into a savagely unhealthy housing market. The median sales price data fell year over year, which I love to see, but many people don’t put too much weight on median sales prices when the monthly data has firmed up with price increases.
If there isn’t a big scream about the decline in the year-over-year pricing, it’s more related to the prices firming up in all the monthly price indexes that aren’t tied to median sales prices.
NAR Research: The median existing-home price for all housing types in May was $396,100, a decline of 3.1% from May 2022 ($408,600). Prices grew in the Northeast and Midwest but fell in the South and West.
I publish the Housing Market Tracker every week which looks at the state of the inventory data so you have an idea of what is going on in almost real time — way before the monthly sales reports come in. This is important because the housing market dynamics shifted from a market that was crashing in demand with inventory rising, to a market with stable demand.
In contrast, inventory growth was so slow this year that we see negative year-over-year prints already in the NAR data. We picked up on this change on Nov. 9, 2022, and now that we are in June of 2023, the data confirms what we were tracking back then.
I looked at the housing market recession over the whole last year on this podcast and it’s ironic that we have traveled all the way back to a savagely unhealthy housing market.


Well not the news we want but I appreciate the analysis and the reality that you bring with this article Logan.
Great analysis! Thank you!