


Today’s jobs report beat estimates, but the internals show the labor market is softening, as the Federal Reserve wants. The data shows that wage growth is cooling down and the job opening quits rate is below pre-COVID-19 levels. This bodes well for those hoping to see a soft landing, and for those hoping for lower mortgage rates.
The 10-year yield has had a wild ride today, but now is an excellent time to look at my macro take on the labor market and explain what the Fed is looking for with the jobs data. The Fed recently said that the labor market getting weaker would force them to act more dovish on rate cuts, and that seeing vigorous job creation wasn’t a big concern. So, let’s look at where we are today with all the labor data and why mortgage rates are still high while the labor market is getting softer.
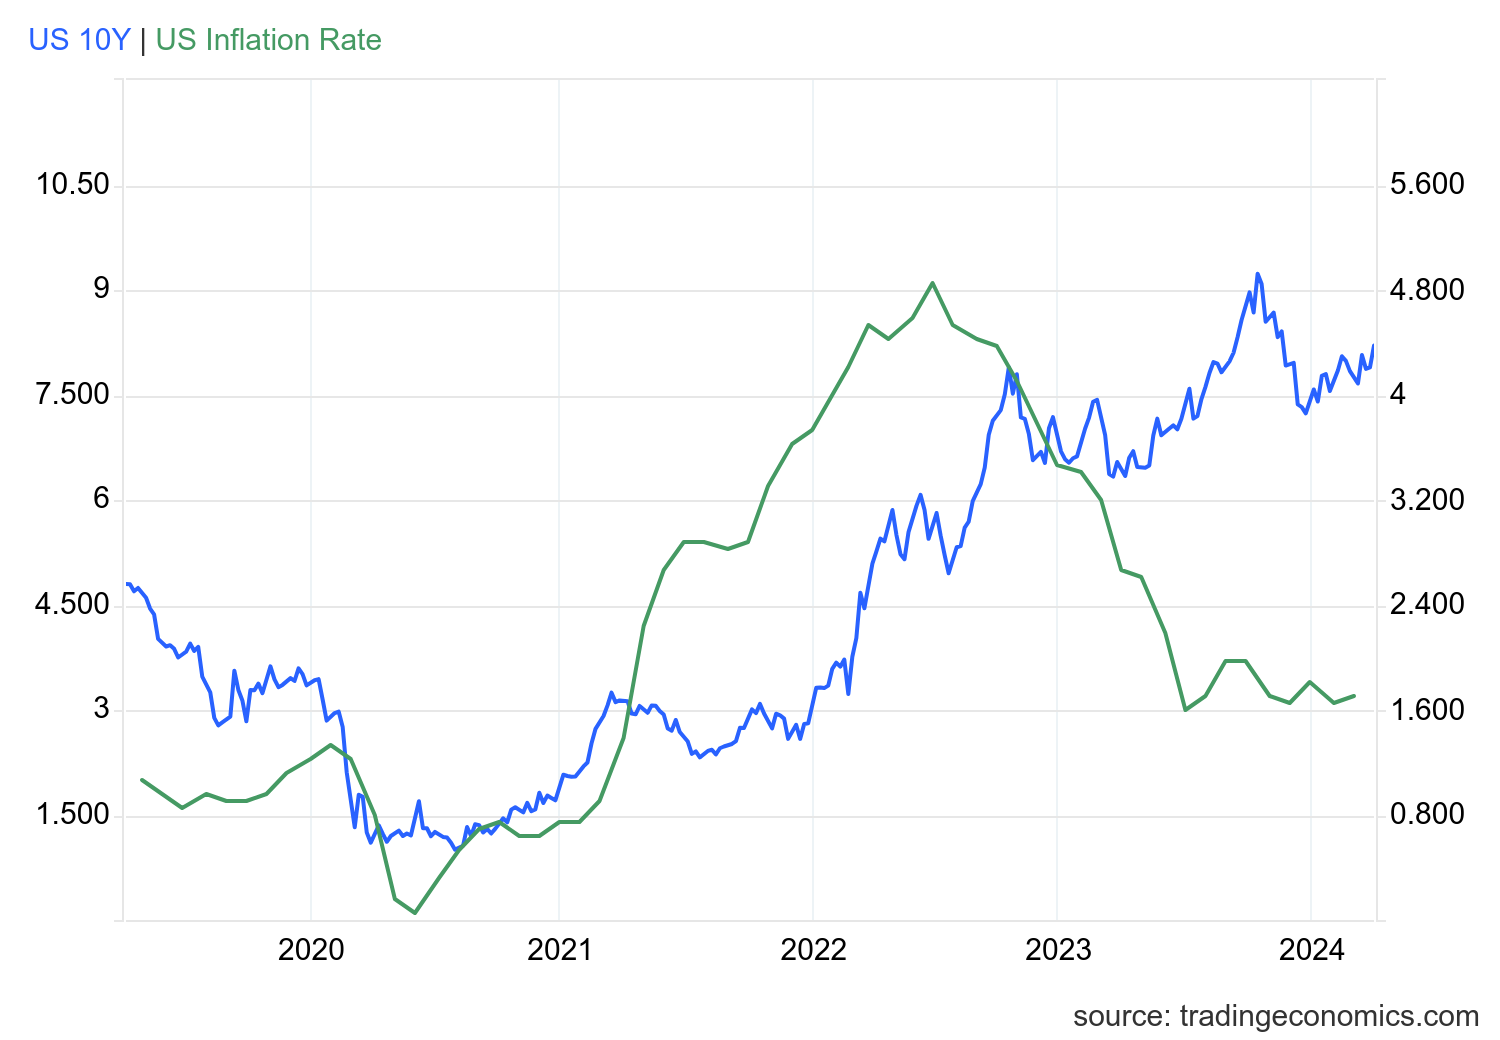
Since 2022, I haven’t believed the Fed would pivot until the labor market breaks. I believe too many people put too much weight on the inflation growth rate slowing as the primary driver for lower mortgage rates. Instead, I have focused on jobless claims data. My target has always been the same: jobless claims breaking above 323,000 on the four-week moving average is recessionary. We are far from that, and as you can see below, the growth rate of inflation has fallen, but bond yields and mortgage rates are still elevated because the labor market hasn’t broken yet.
Below, CPI inflation’s growth rate is at 3.2%, while the 10-year yield is at 4.36%. I know it’s wild to think, but we had lower rates with hotter inflation data.
The one data line that has been improving, which Chairmen Powell mentioned at the last press meeting, is jobless claims, which have been falling for months. If this data line ran above 300,000, we would have a different mortgage rate discussion today. Remember, the labor market is getting softer, but it’s not breaking. Once it breaks, that will force the Fed to move,and bond yields will have already gone lower.
How did we get here with the labor market? Here’s my explanation, which all started during COVID-19.
1. I wrote the COVID-19 recovery model on April 7, 2020, and retired it on Dec. 9, 2020. By that time, the upfront recovery phase was done, and I needed to model out when we would get the jobs lost back.
2. Early in the labor market recovery, when we saw weaker job reports, I doubled and tripled down on my assertion that job openings would get to 10 million in this recovery. Job openings rose all the way to 12 million and are currently over 9 million. Even with the massive miss on a job report in May 2021, I didn’t waver.
Currently, the job openings, quit percentage, and hires data are below pre-COVID-19 levels, which means the labor market isn’t as tight as it once was. The employment cost index has slowed recently as well. Today’s jobs report showed slower wage growth than earlier in the cycle.
3. I wrote that we should get back all the jobs lost to COVID-19 by September 2022. This would be a speedy labor market recovery at the time, and it happened on schedule, too.
4. This is the key one right now: If COVID-19 hadn’t happened, we would have between 157 million and 159 million jobs today, which is in line with the job growth rate in February 2020. Today, we are at 158,133,000.This is important because job growth should be cooling down now. We are more in line with where the labor market should be when the average is 140,000 to 165,000 monthly. So, for now, the fact that we aren’t trending between 140,000-165,000 means we still have a bit more recovery kick left before we get down to those levels.
From BLS: Total nonfarm payroll employment rose by 303,000 in March, and the unemployment rate changed little at 3.8 percent, the U.S. Bureau of Labor Statistics reported today. Job gains occurred in health care, government, and construction.
Here are the jobs that were created and lost in the previous month:
In this jobs report, the unemployment rate for education levels looks like this:
- Less than a high school diploma: 4.9%
- High school graduate and no college: 4.1%
- Some college or associate degree: 3.4%
- Bachelor’s degree or higher: 2.1%
A positive trend for the Fed with a softer labor market is that wage growth is cooling down. The Fed can live with 3% wage growth and 1% productivity growth, and now that wage growth is slowly moving under 4%, they will feel more like pilots who can land the plane.
Productivity data has indeed been more robust recently. Still, the Fed doesn’t believe in the more robust productivity numbers, so wage growth closer to 3%- 3.5% is more in their comfort zone.
On a side note, a positive story in housing this year is that the mortgage spreads are improving, and we haven’t had a stress market event like last year to push them higher. This is a huge plus because if the spreads can get back to normal with lower yields, we have a sub-6% mortgage rate market and we can certainly work with that.
All in all, the labor report is showing the same trend I have been seeing for some time now: the labor market is getting softer, but we are still creating more jobs than I was expecting at this point of the cycle. If we are still growing jobs over 165K once we break over 159,000,000 then my forecast model was incorrect, and the labor dynamics are more robust than I anticipated, so less than 1,000,000 jobs left before we cross that bridge.
However, after considering all the drama we had to deal with this week, we came out okay on this jobs report. It does provide a path for the Federal Reserve to see the softer wage growth data and land the plane.


