


As the national housing market continues to recover from the worst financial crisis in recent history, some cities are standing out as the “healthiest” markets for home equity, a recent analysis suggests.
In determining the healthiest housing markets in the U.S., WalletHub compared 25 of the largest metropolitan, as defined by the American Housing Survey, across 10 key metrics, including home equity as a percentage of home value. To create its rankings, WalletHub relied on data from the U.S. Census Bureau and the Department of Housing and Urban Development.
When it comes to equity level, New York City ranks as the top metro area with home equity at 47% of home values, according to the WalletHub analysis.
The metro was followed mostly by other northeastern cities like Boston (43%), Rochester, N.Y. (38%), Northern New Jersey (38%) and Philadelphia (36%), which was tied for fifth with San Antonio.
Compared to the national average, equity levels were at their highest peak just as the housing bubble was getting ready to burst in 2007 at 46%, WalletHub notes. By 2009, equity levels fell to around 37% before picking up again in the years following the market crash in 2011 (41%) and then falling in 2013 to an average of 30%.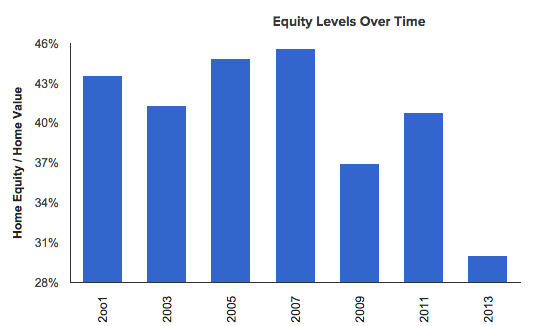
When comparing top states to those ranking at the bottom, equity as a percentage of the home’s value is four times higher in the New York metro area than in the Las Vegas area, which ranked twenty-fifth at 12%.
Las Vegas also had the highest percentage of mortgages underwater with 38.58%, according to the analysis. Rochester, N.Y., on the other hand, had the lowest share of underwater mortgages with 6.13%.
While WalletHub’s analysis did not dissect home equity levels among homeowners’ age groups, senior homeowners have been seeing their home equity steadily increase over the years.
In the first quarter of 2015, the estimated aggregate value of seniors’ home equity was $3.96 trillion, according to the National Reverse Mortgage Lenders Association/RiskSpan Reverse Mortgage Market Index released in June.
The increase represents the twelfth consecutive quarter in which the index has risen, and seniors’ home equity is now 1% below its peak level of $4 trillion recorded in the fourth quarter of 2006.
Currently, senior equity levels represent a 34% recovery since the post-Recession trough in the second quarter of 2011, when equity levels among seniors fell to an estimated $3 trillion, according to the NRMLA/RMMI analysis.
Written by Jason Oliva

