


Active weekly housing inventory growth slowed slightly last week, but it’s still running at a healthier clip than in 2023. I have a simple model with mortgage rates being above 7.25%: weekly inventory data should grow between 11,000-17,000 per week. Last year, we never hit that target. We have now seen it for two weeks as inventory grew by 13,247.
Weekly housing inventory data
We’ve now had back-to-back weeks of healthy housing inventory growth and spring 2024 is much healthier than spring 2023. Last year, we didn’t have any weeks of weekly active inventory growth above 11,000. Not counting the snap-back week after Easter, we have had two consecutive weeks of healthy inventory growth and next week we should surpass the inventory high of 2023.
- Weekly inventory change (April 19-26): Inventory rose from 543,044 to 556,291
- The same week last year (April 14-21): Inventory rose from 414,701 to 421,924
- The all-time inventory bottom was in 2022 at 240,194
- The inventory peak for 2023 was 569,898
- For some context, active listings for this week in 2015 were 1,071,283
New listings data
Another positive story for 2024 is that we have more sellers who will be buyers. This isn’t saying too much since 2023 had the lowest recorded level of new listings ever, but it’s still a plus in my book. Here’s the new listings data for last week over the last several years:
- 2024: 70,665
- 2023: 63,236
- 2022: 72,009
Price-cut percentage
In an average year, one-third of all homes take a price cut — this is standard housing activity. When mortgage rates increase, demand falls and the price-cut percentage grows. When rates drop and demand improves, the percentage falls.
We had an abnormal decline last week, which I didn’t believe was accurate because it occurred in a week where we saw good inventory growth. This week’s growth makes more sense with the data we have had over the past 14 days.
- 2024: 32.5%
- 2023: 29.2%
- 2022: 19.2%
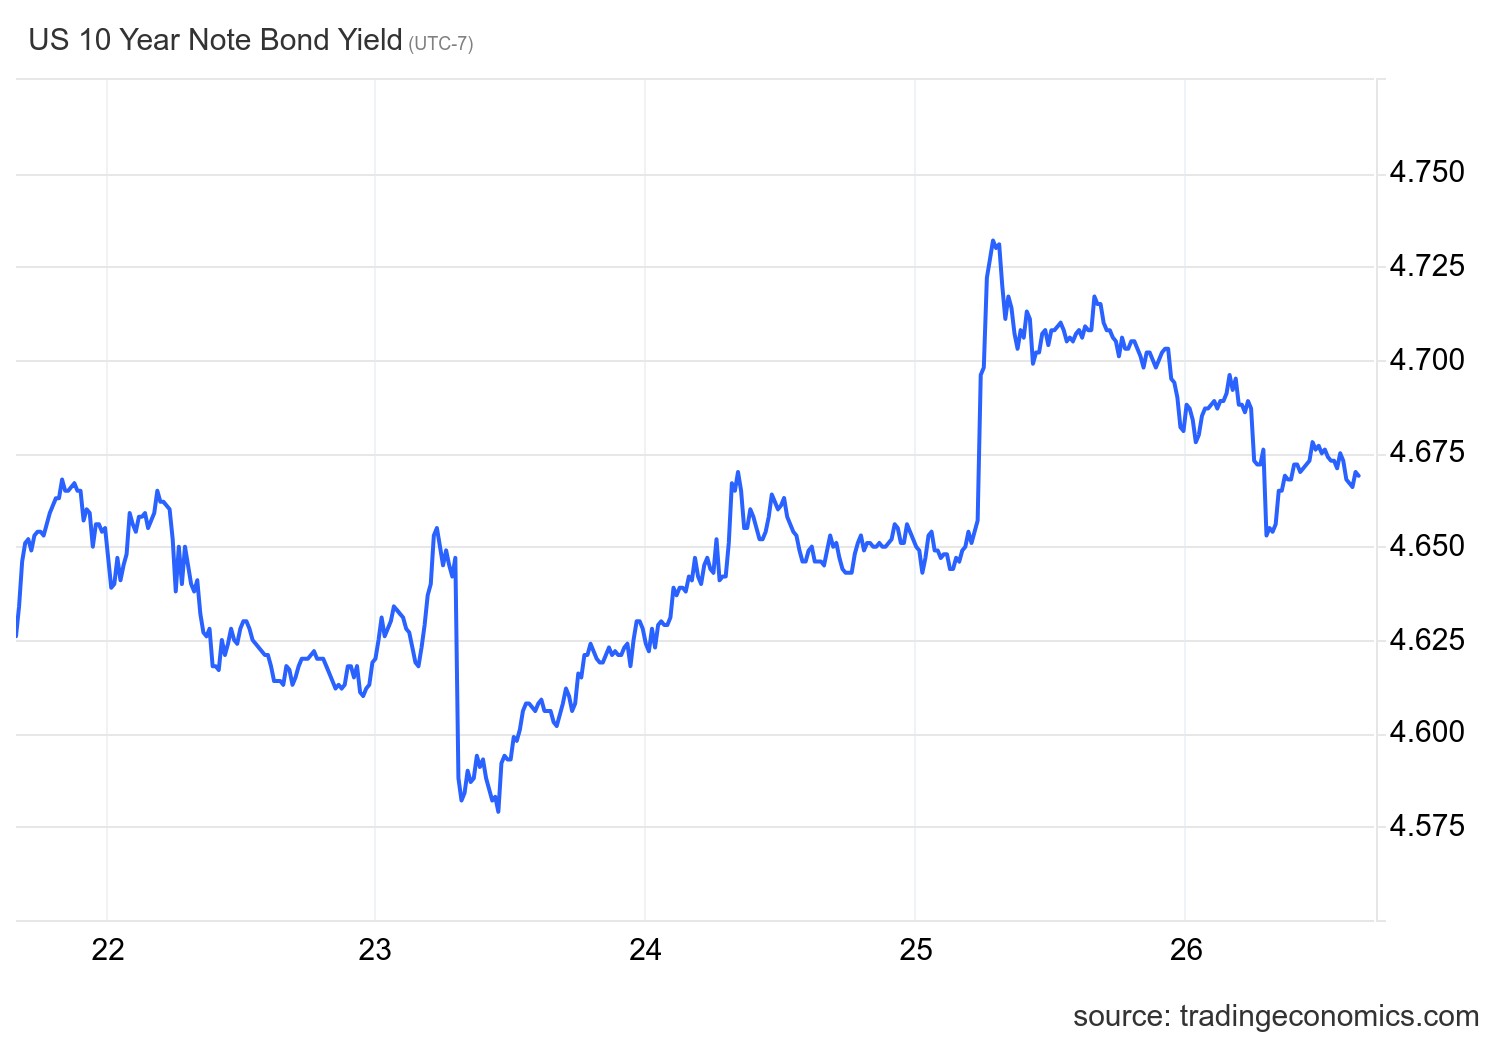
10-year yield and mortgage rates
Economic data created headline events last week that made the bond market go on a roller coaster with the GDP report, jobless claims and the Fed’s favorite inflation data, the PCE.
The GDP report came in as a big miss, but the internals of the report showed robust spending and the prices paid were hot. That sent the 10-year yield rising because the jobless claims data came in really good as well Then the inflation report came in a bit hotter than estimates. However, I believe bond traders were expecting something hotter than the month-to-month core CPI print of 0.3%, thus the bond market rallied and sent yields lower. All in all, we ended the week as we started.
The mortgage spread data got worse last week. However, it’s much improved this year compared to last, when mortgage rates would have been 31 basis points higher if we had similar spreads.
Purchase application data
Purchase application data didn’t have much movement last week on a week-to-week basis, but it is still showing double-digit declines from last year. The purchase application data has collapsed so much that we have a very low bar to show growth in the future so keep that in mind when we start to see growth. Last week we saw a 1% week-to-week decline and we are down 15% year over year.
Since November 2023, when mortgage rates started to fall, we have had 11 positive prints versus eight negative prints and two flat prints week-to-week. Year to date, we have had five positive prints, eight negative prints and two flat prints.
The week ahead: Jobs week, employment cost index and home prices
It’s going to be a massive week for data, as jobs week always is. However, considering where the 10-year yield is, this week’s data will be more important than it’s been all year.. We also have the employment cost index, which the Fed tracks quarterly, and we have the national home-price data. So this week can be wild for mortgage rates as the all-important labor data is the key for rates going out for the rest of the year. Once the labor data starts to show some real weakness, that is a more suitable economic backdrop for rates to head lower and stay lower. However, for now, the labor market is getting softer, but not breaking. Hopefully we’ll see a third straight week of inventory growth.


