

We finally got mortgage rates to rise, and for people like me who have been concerned about how unhealthy the housing market was last year — and it got a lot worse this year — it’s a blessing that was much needed. Recently, I downgraded the housing market from an unhealthy housing market to a savagely unhealthy housing market, something I discussed with HousingWire Editor in Chief Sarah Wheeler on our recent podcast.
For 2020-2024, I set some critical parameters for sales and price growth, knowing that this marketplace will be different from the market we had from 2008 to 2019. This is why I always separate my work into those two periods.
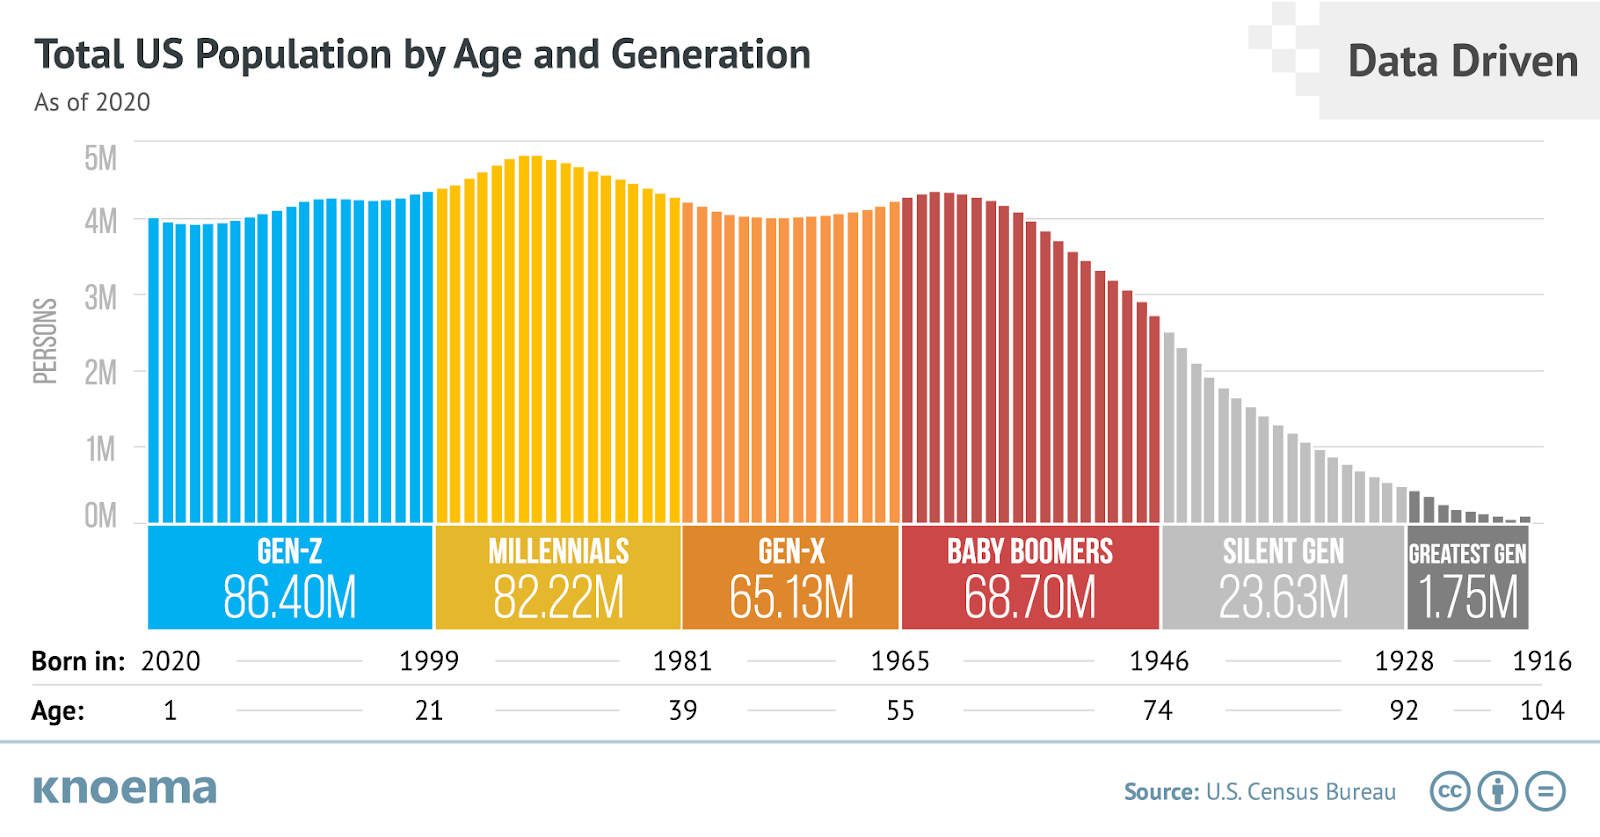
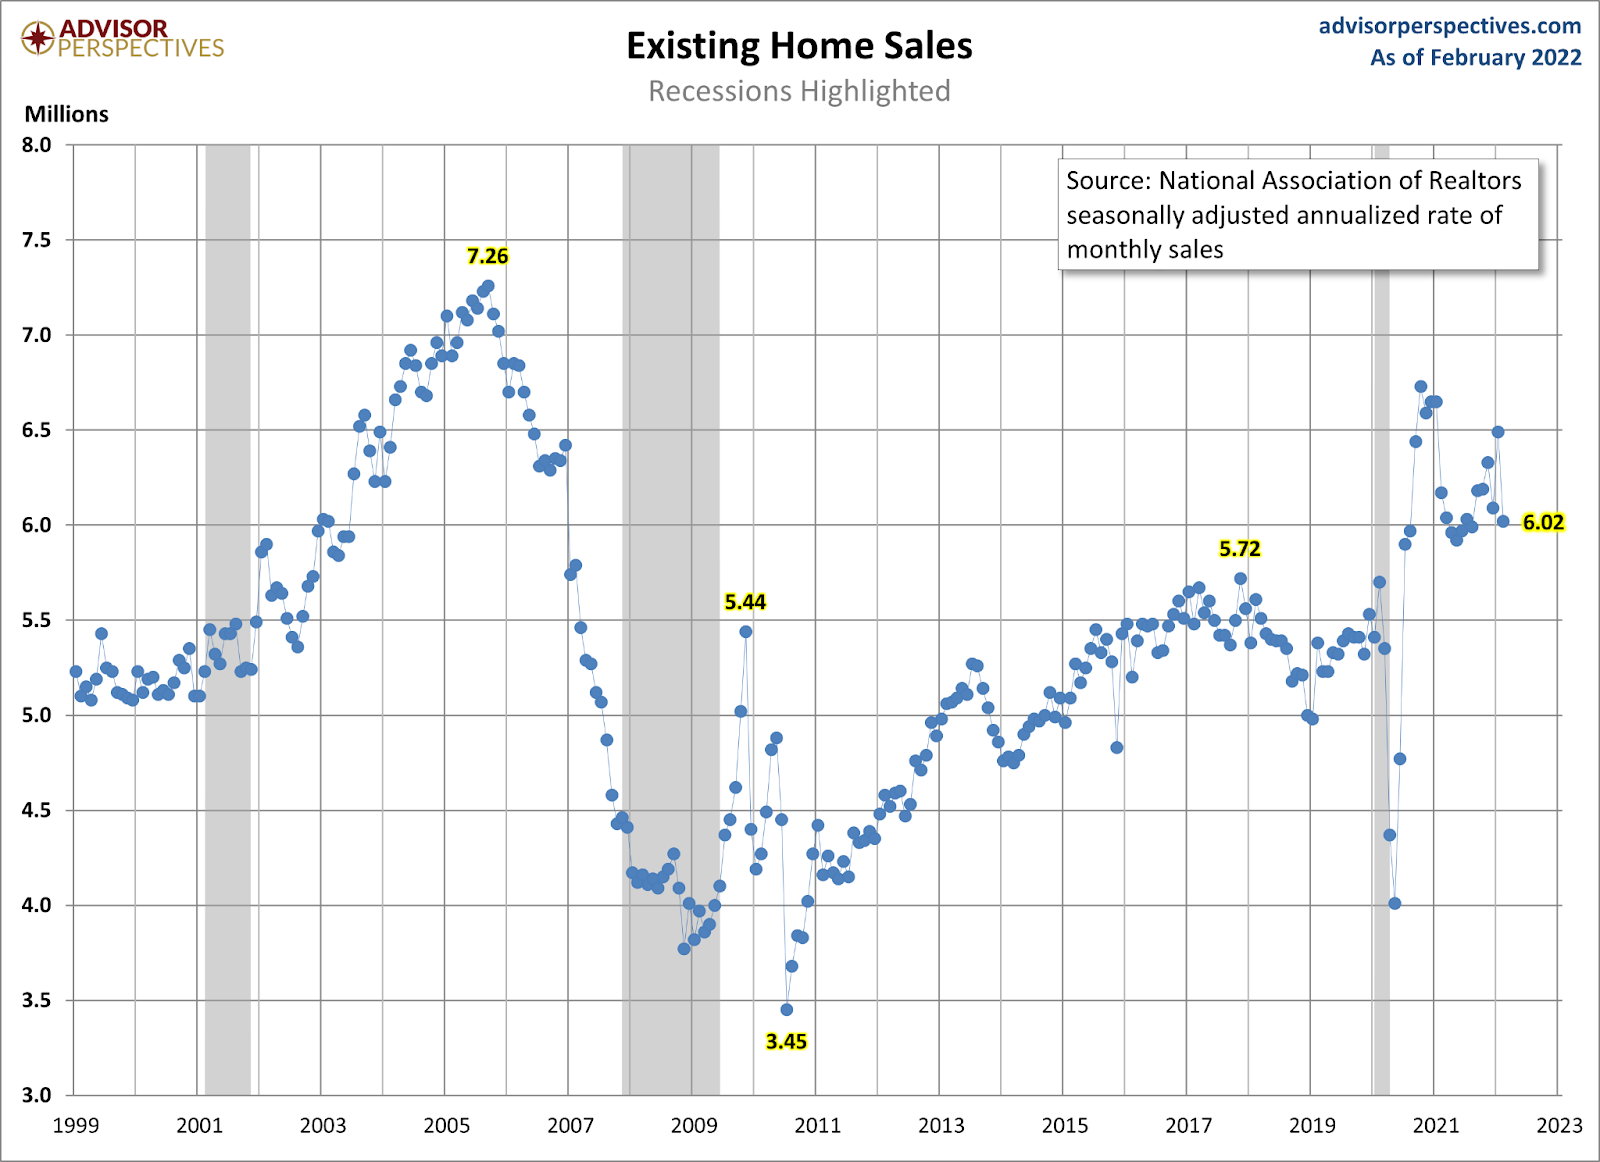
First, total home sales should be 6.2 million or higher during 2020-2024. This is new home sales and existing home sales combined. The demographic bump in 2020-2024 is giving us a push in demand.
Second, because of the downtrend in inventory since 2014 and the demand pick-up we will see in the years 2020-2024, we had a risk of home prices accelerating too much. So, I set a five-year home-price cumulative growth level of 23%. If home prices grew between 0-23% in the five years of 2020-2024, we should be OK with where wage growth was going.
The fact that the 23% home-price growth level has been smashed in just two years and inventory just collapsed to all-time lows has created the most unhealthy housing market post-2010. The only risk to that 6.2 million line in the sand has been this:
- Home prices grow above that 23% level: check
- Mortgage rates spike higher: check
The two things I had as risk factors are now in play.
We have a risk to sales here, and the one area where we could be most in trouble is the new home sales sector. This sector on an apples-to-apples basis is more expensive than the existing home sales market. It’s also driven more by mortgage buyers who tend to be older and make more money than the new-home buyers. Compared to the existing home sales marketplace, it doesn’t have a high cash buyer or investor buyer profile.
Today, new home sales came in as a miss of estimates at 772,000, but the revisions were all positive so there’s not too much going on here. The builders are struggling to finish their homes, and there is a risk to builders in a rising rate environment when you have people wait so long to build a house.
Regarding the new home sales sector itself, it’s just an OK marketplace and has been for some time.
From Census: Sales of new single‐family houses in February 2022 were at a seasonally adjusted annual rate of 772,000, according to estimates released today by the U.S. Census Bureau and the Department of Housing and Urban Development. This is 2.0 percent (±11.9 percent)* below the revised January rate of 788,000 and is 6.2 percent (±13.7 percent)* below the February 2021 estimate of 823,000.
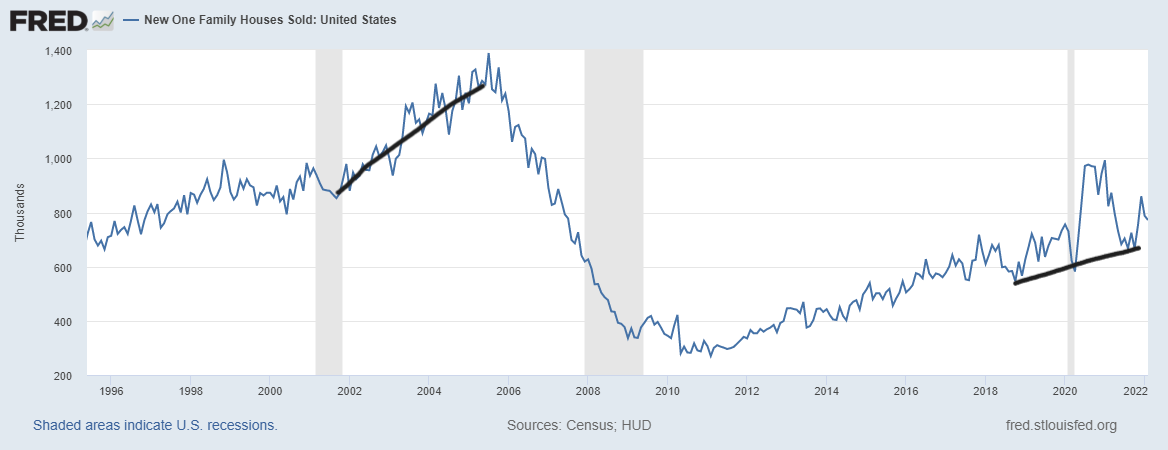
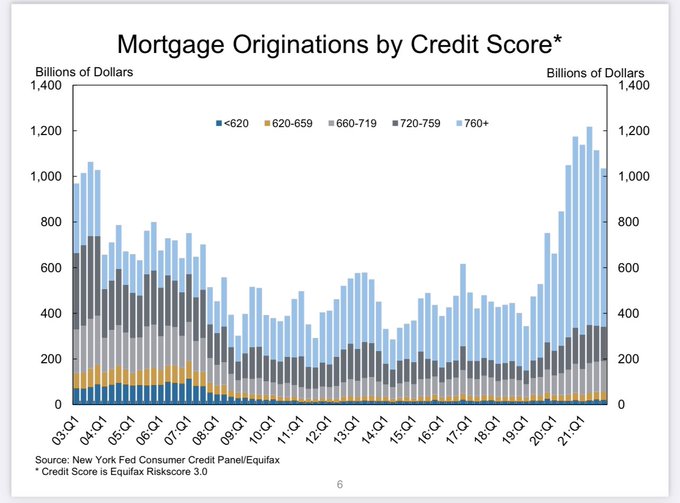
As you can see below, the new home sales market from 2018-2022 doesn’t look like the housing market we had from 2002-2005. Without exotic loan debt structures, credit always has limits, which is a good thing. Could you imagine this housing market if we eased lending standards? I would be protesting in front of Congress and speaking at congressional hearings if lending standards were reduced.
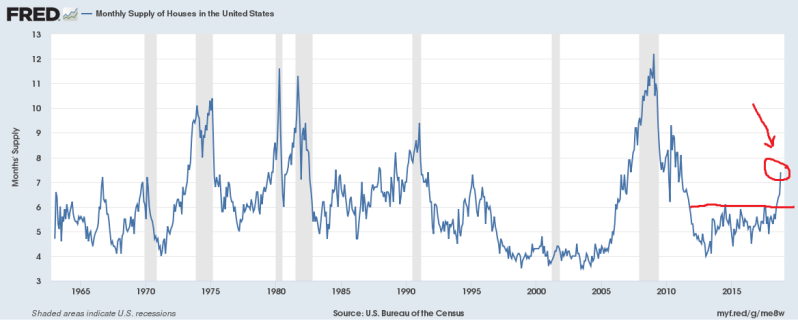
From Census: The seasonally‐adjusted estimate of new houses for sale at the end of February was 407,000. This represents a supply of 6.3 months at the current sales rate.
My rule of thumb for anticipating builder behavior is based on the three-month average of supply:
- When supply is 4.3 months and below, this is an excellent market for the builders.
- When supply is 4.4 to 6.4 months, this is an OK market for the builders. They will build as long as new home sales are growing.
- When supply is 6.5 months and above, the builders will pull back on construction.
Currently, the monthly supply headline is 6.3 months, and the three-month average is at 5.93 months. This is just an OK marketplace, so don’t look for the builders to be really pressing to build now, especially when rates have risen so much. They’re mindful of higher rates because in 2013, 2014 and 2015 they had to deal with a miss in sales expectations. Then in 2018, when mortgage rates got to 5%, we saw a supply spike in the monthly home sales data and their stocks were down over 30%.

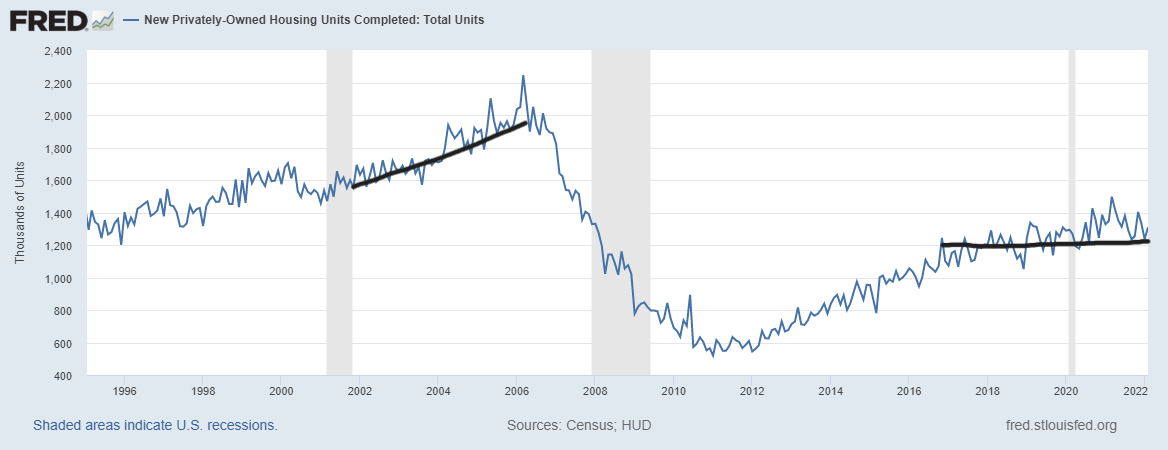
As you can see below, the completion data looks terrible. It’s taking forever to build a home and that has created a huge number of homes under construction. The risk is that cancellations can rise by the time the home is ready for move in.
From Census: The median sales price of new houses sold in February 2022 was $400,600. The average sales price was $511,000.
As always, the years 2020-2024 were going to be different. The builders have pricing power that means they can push the price onto their consumers. Like home sellers, they try to make as much money as possible. The only thing we have that creates balance in this market is higher rates, hence why I am team higher rates.
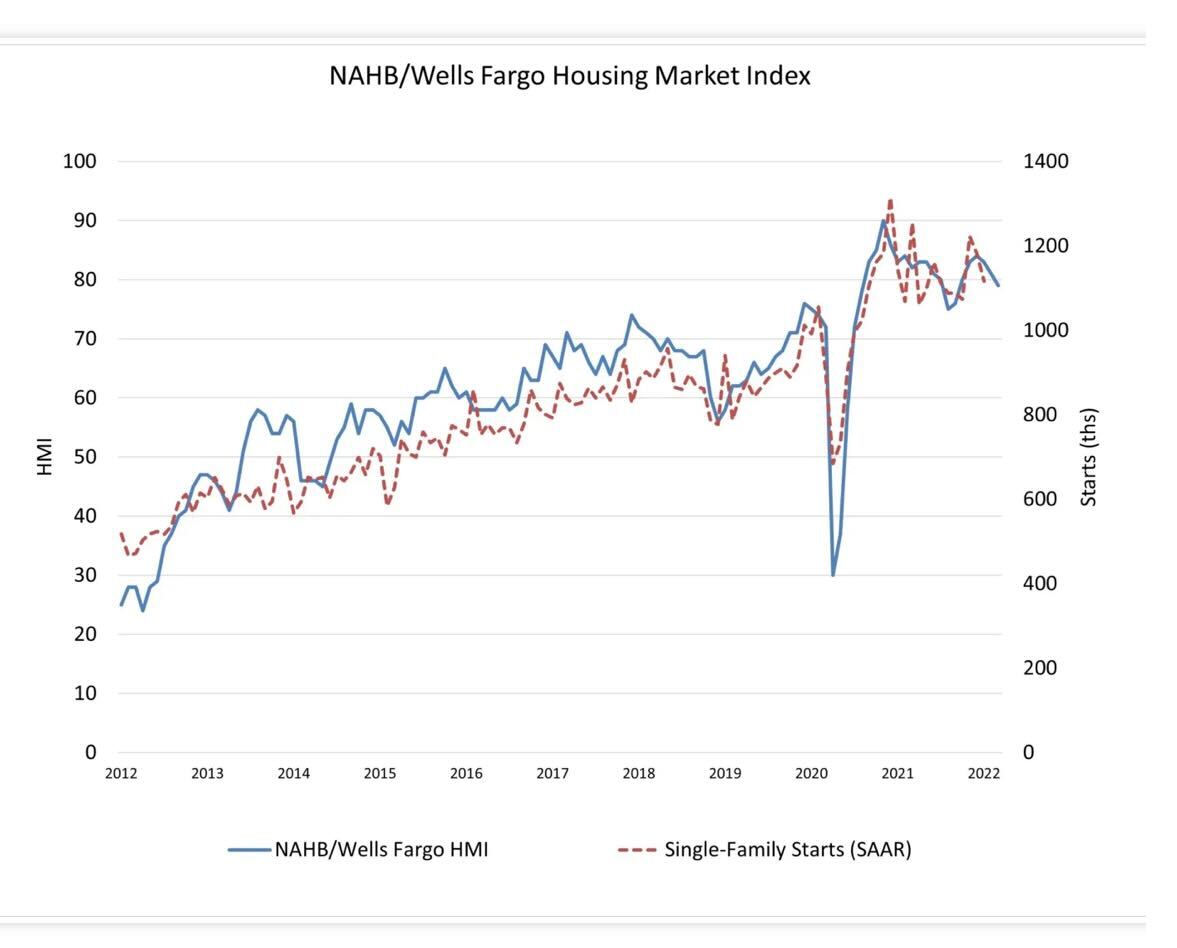
From the National Association of Home Builders, the builder’s confidence has faded recently, and you have to go with this data because it has been good historically with where housing starts and new home sales. Until you find a base on the data line, go with the trend. We no longer have the COVID-19 comps in play with the moderation in the data that needed to happen.

Purchase application data
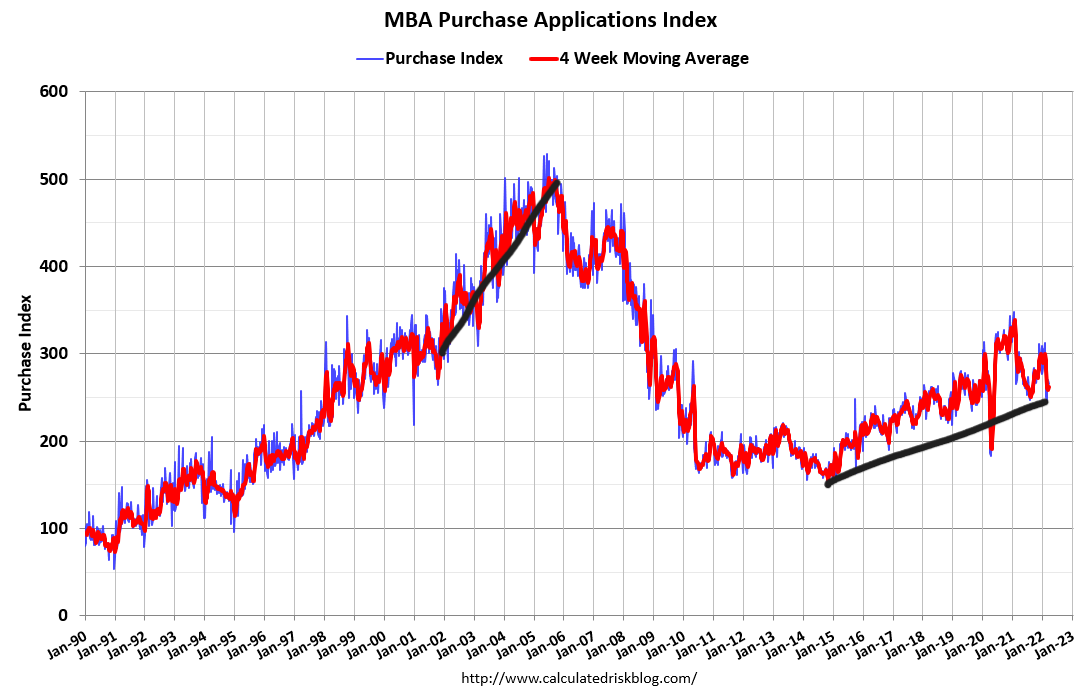
Regarding the purchase application data that came out on Wednesday, some context needs to be discussed here. Purchase application data is down 2% week to week, 12% year over year. This data line has been negative year over year since June of 2021. A big theme of my work on HousingWire is to try to talk about housing data making COVID-19 adjustments because if you didn’t realize that we had some high comps due to the make-up demand of COVID-19, you might have thought housing was crashing in the middle of last year.
First, as you can see from the chart below, the market we had from 2002-2005 never existed in housing from 2014-2022. We cannot have a credit boom because speculation debt has been taken off-grid post-2010 with credit. It was always a slow and steady ride from the 2014 lows.
This is the year-over-year data since the start of the year. I have talked about how we would still have some makeup demand COVID-19 comps into February, and that’s what happened from my view: makeup demand spilled over into early 2021.
- Jan. 5: -12%
- Jan. 12: -17%
- Jan. 19: -13%
- Jan. 26: -11%
- Feb. 2: -7%
- Feb. 9: -12%
Those make-up demand comps are now gone.
- Feb. 16: -7%
- Feb. 23: -6%
- March 2: -9%
- March 9: -7%
- March 16: -8%
Now, this week the year-over-year data shows -12%. You can see some of the weakness, but nothing too drastic. We can compare these previous times when housing was soft too.
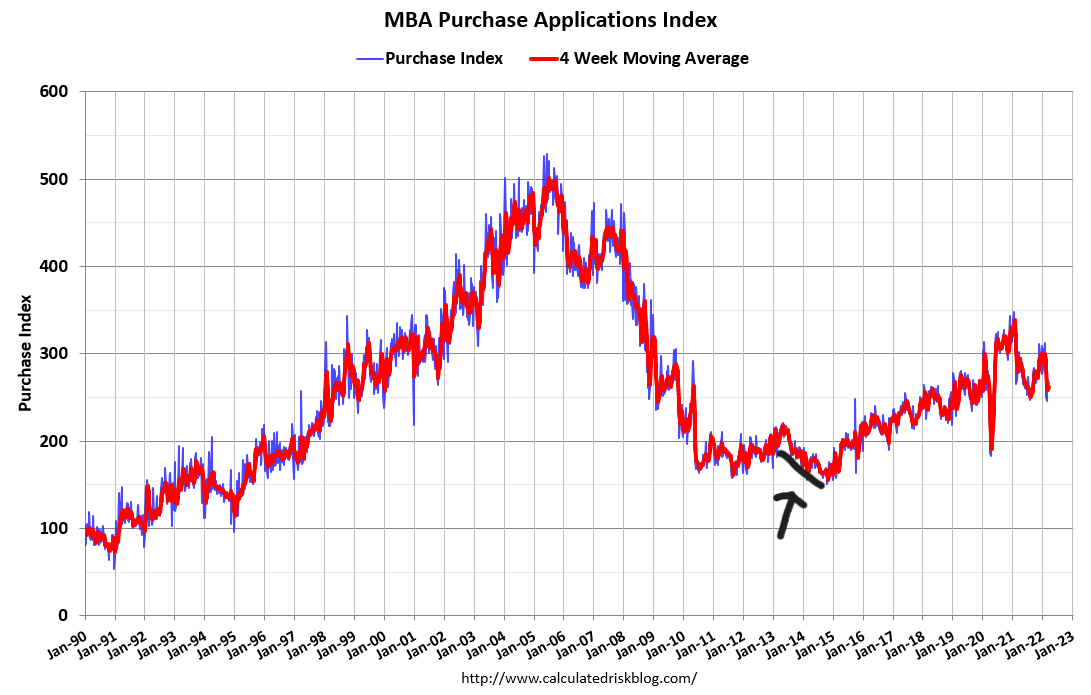
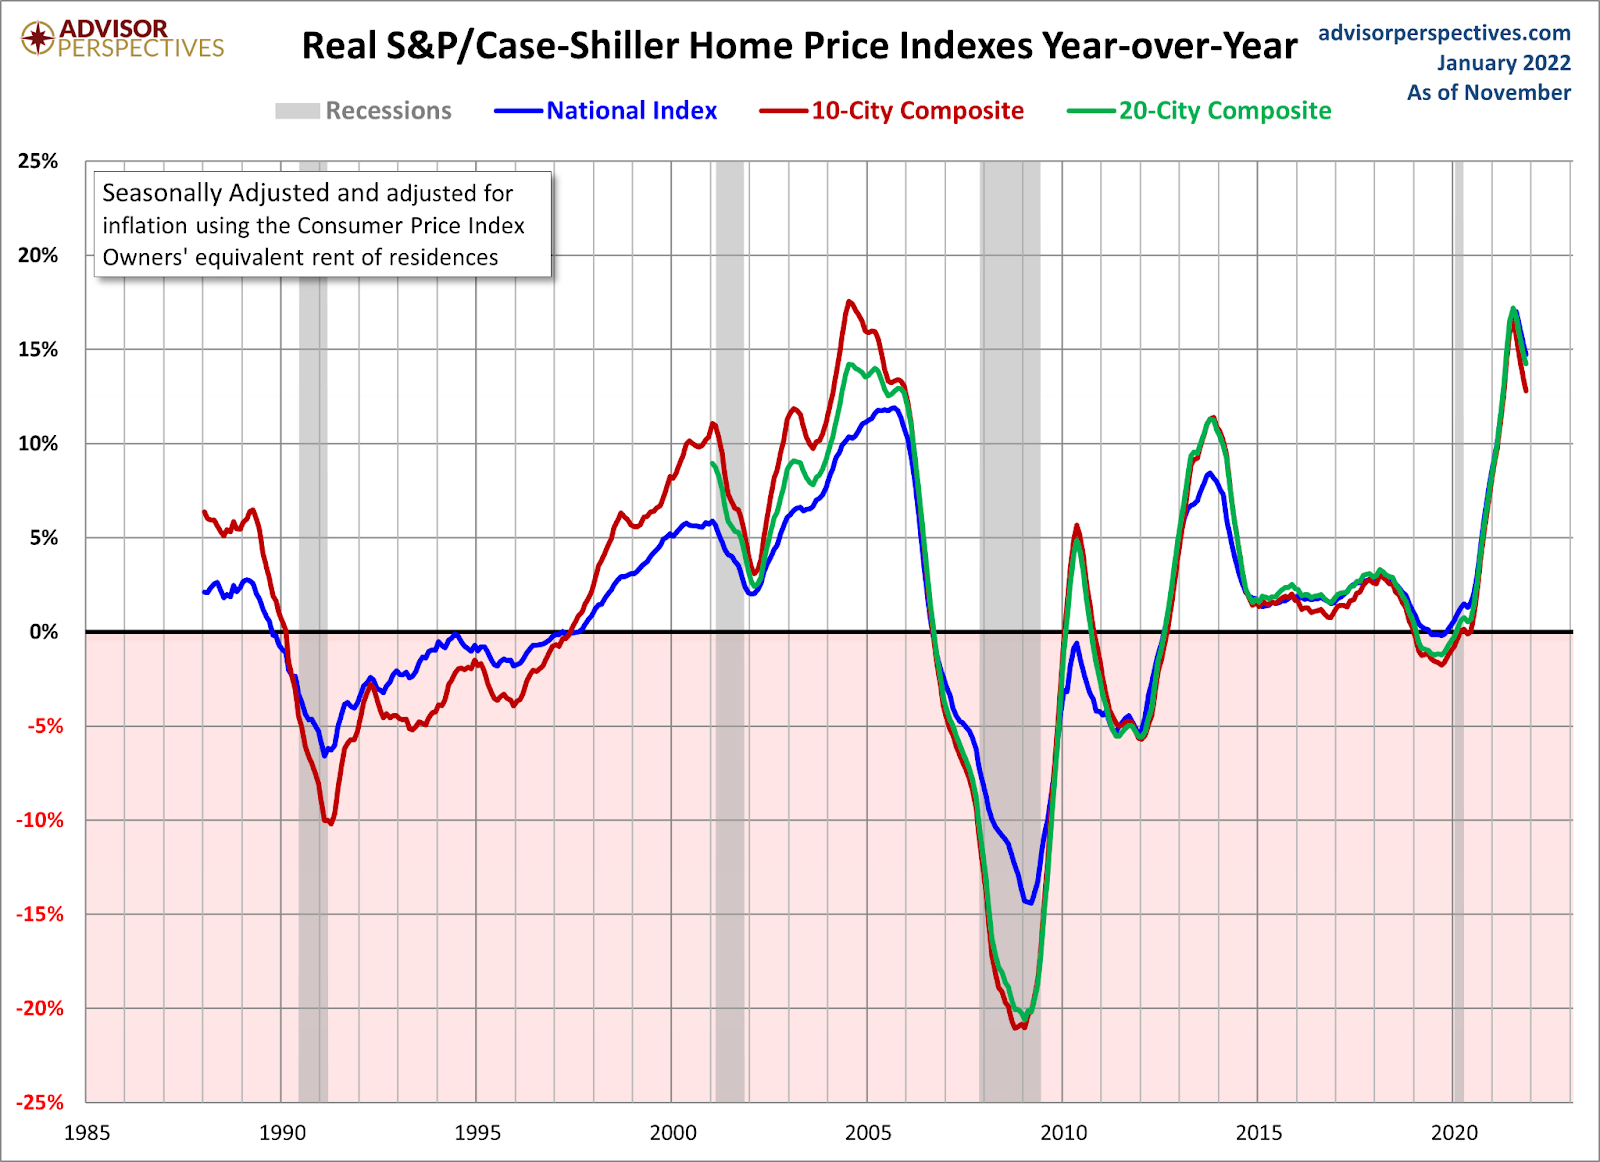
In 2013-2014, when the 10-year yield went from 1.60% – to 3%, it created a negative 20% year-over-year data trend for most of the year. As you can see below, that downtrend was noticeable but we are far from those levels today.
2014 was the last year total inventory rose from weakness in demand. When rates rose toward 5% in 2018, we only had three negative year-over-year prints in the purchase application data, and the total inventory didn’t grow that year.
This year, inventory has collapsed again, and I have downgraded the housing market to a savagely unhealthy market because we simply lack homes, creating forced bidding. For me to stop saying this housing market is unhealthy, I need to see inventory get back up in a 1.52 – 1.93 million range, which takes us back toward 2018-2019 levels. Historically, that level of inventory is low but the market was still much more balanced then.
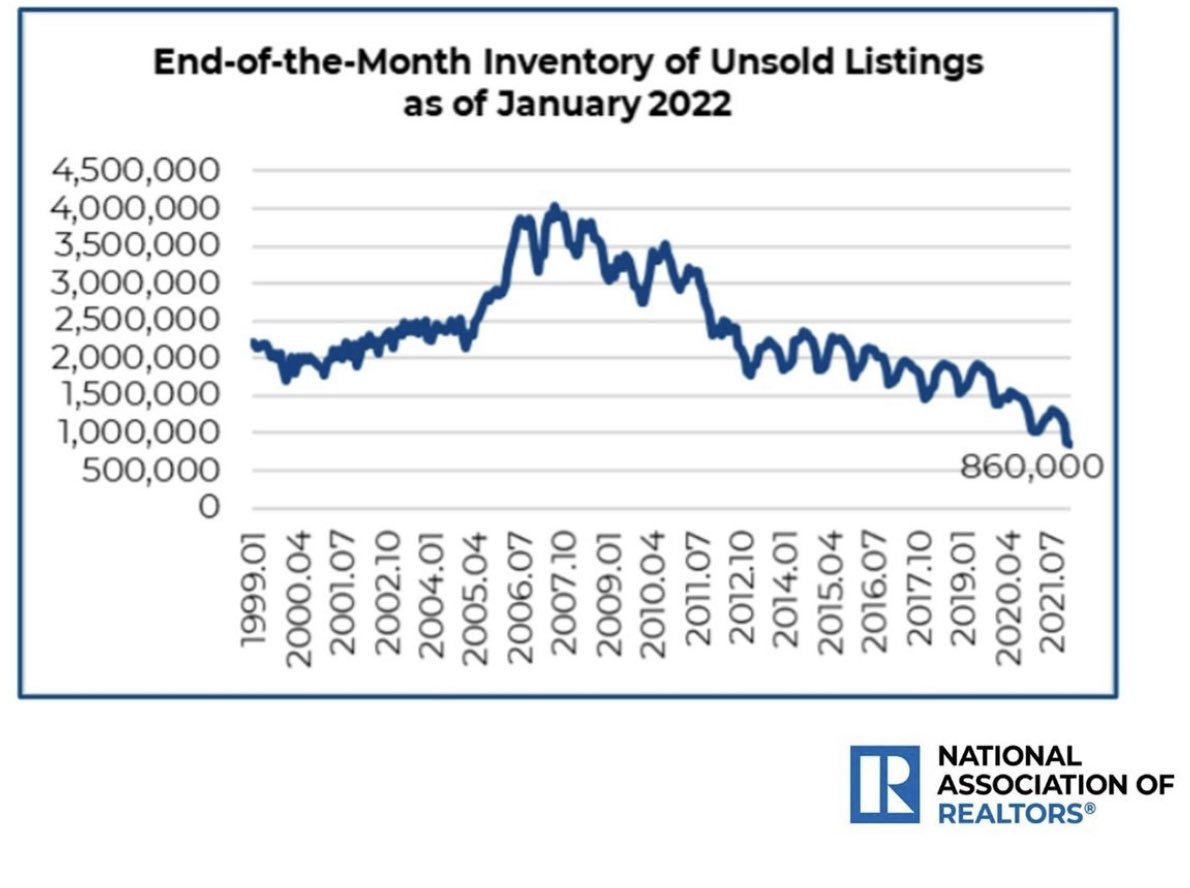
Speaking at a housing conference in 2019, I explained to the audience that it was a good thing that real home prices went negative. I had a big smile back then as housing was balanced. We don’t have a balanced housing market any longer.
Why won’t inventory grow? At the end of 2017, existing home sales went from 5.72 million and trended toward 4.98 million by Jan 2019, and we saw no inventory growth back then!
Housing tenure has doubled; homeowners on paper in 2018-2019 were already in great shape and now look better than ever on paper with the last refinance boom. What a hedge against inflation this year! But, housing tenure has become a severe problem in the housing market as inventory is collapsing in 2022.
While I am on team higher rates and welcome this significant bit of news to try to create more days on the market to cool this terrible home-price growth down, I am not blinded by the reality that this can also cause issues with home sellers who want to buy a home. Home seller data has been showing some stress, and that is the last thing I wanted to see right now.
However, it makes sense when inventory has collapsed to such low levels, and now rates are higher. Are you going to risk selling your home, not getting the home you want, and renting at a higher cost? This is the last thing I wanted to see in 2022, and since we are so close to April, it’s a reality we have to deal with for the rest of the year as long as inventory is still negative year over year.
Going out for the rest of the year, keep an eye out for that new home sales data. One of my six recession red flags is that new home sales and housing starts fade into a recession. Because the new home sales marketplace means more to an economy than the existing home sales marketplace, it’s more important to look at that.
Housing construction jobs and big-ticket item purchases are things that move with the demand of new homes. The existing home sales market results in a transfer of commission, moving trucks and some big-ticket item purchases.
Going back to my summer of 2020 premise of what can cool down the housing market, a 10-year yield over 1.94% should. Even though mortgage rates are still low historically, rising rates do matter, and with the home-price growth we saw in 2020, 2021 and 2022, it matters even more. You can see why I believe in economic models; they keep us in line.


Another fantastic article by Logan!!
How long does the 10 year need to stay at this level to cool it off enough?
Excellent framing of both time periods and method to analyze them.