


Mortgage rates have risen recently but they could be much worse than they are today. As someone who doesn’t believe the Federal Reserve has pivoted and that the Fed enacted a COVID-19 housing policy to keep existing home sales depressed, It’s not shocking to me that rates are still this high, even though we had lower rates with a higher growth rate of inflation data.
Mortgage rates and the 10-year yield
The 10-year yield is the key for housing in 2024. In my 2024 forecast, I put the 10-year yield range between 3.21%-4.25%, with a critical line in the sand at 3.37%. If the economic data stays firm, we shouldn’t break below 3.21%, but if the labor data gets weaker, that line in the sand will be tested.
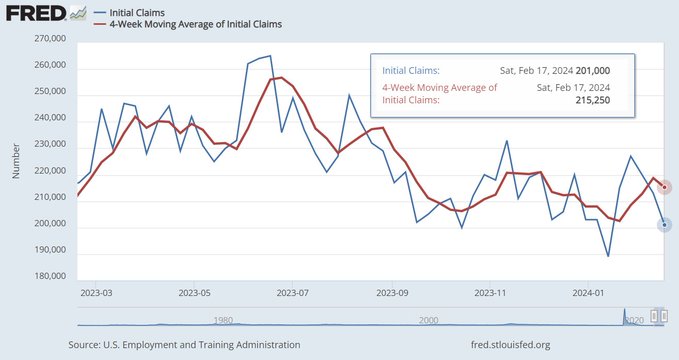
The most important data line for me, along with mortgage rates, is jobless claims data because I value labor data over inflation. The jobless claims data got better recently so it’s not a surprise to me that mortgage rates and the 10-year yield are still high.
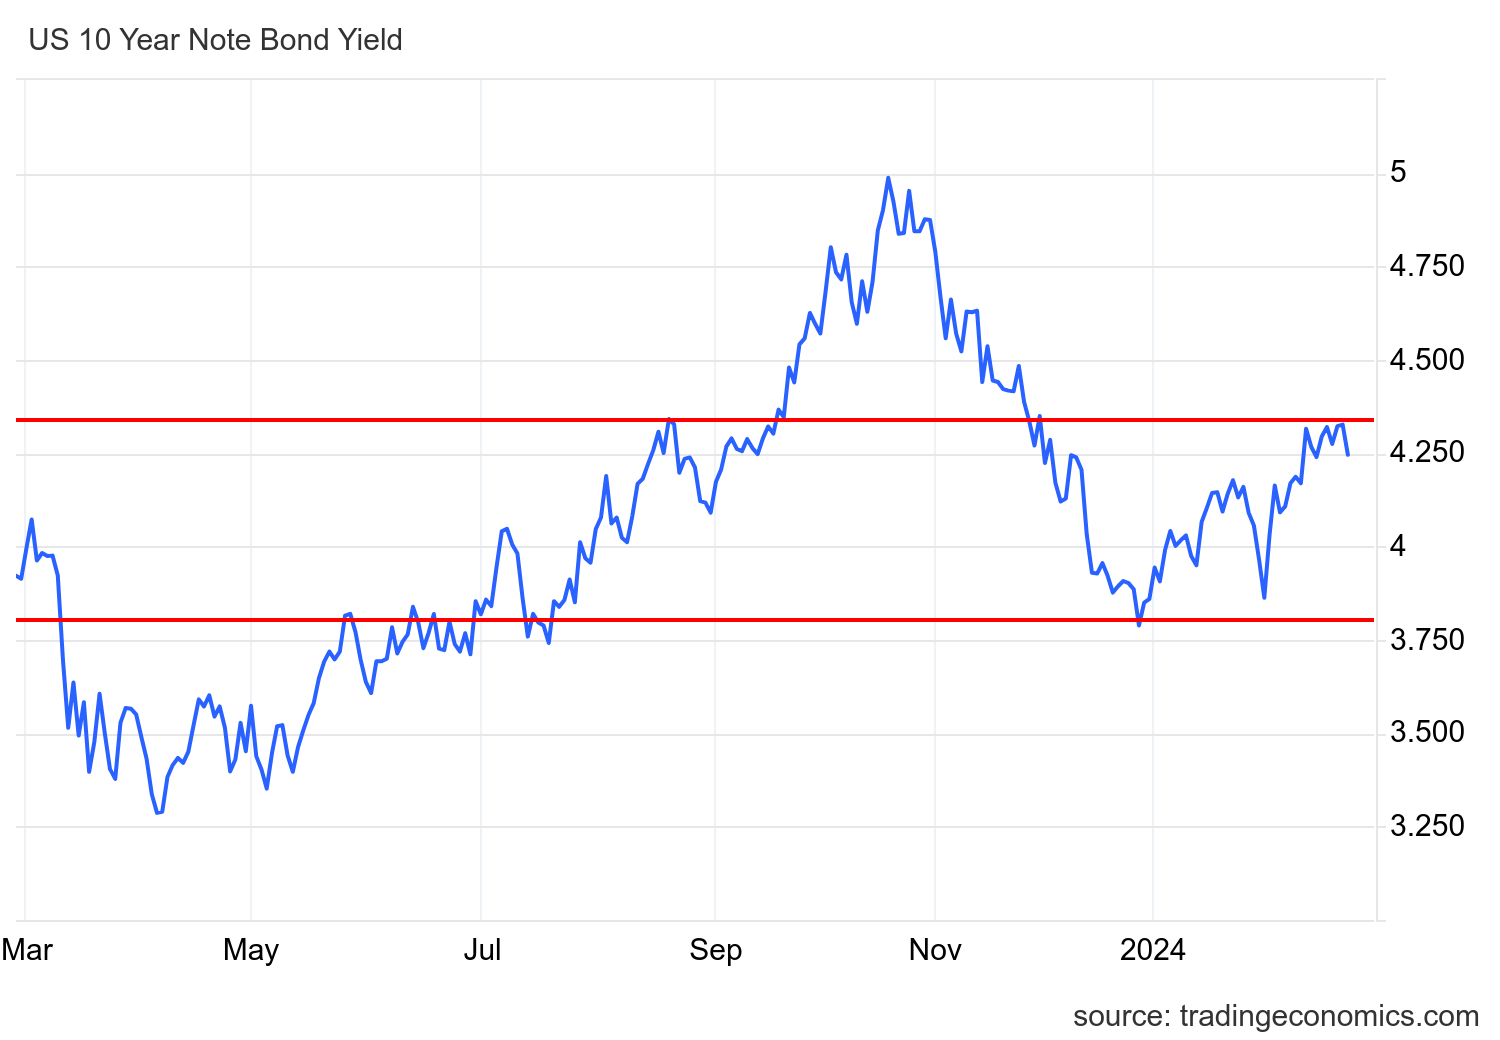
Below is a look at the 10-year yield over the past few years.
Serious mortgage rate talk
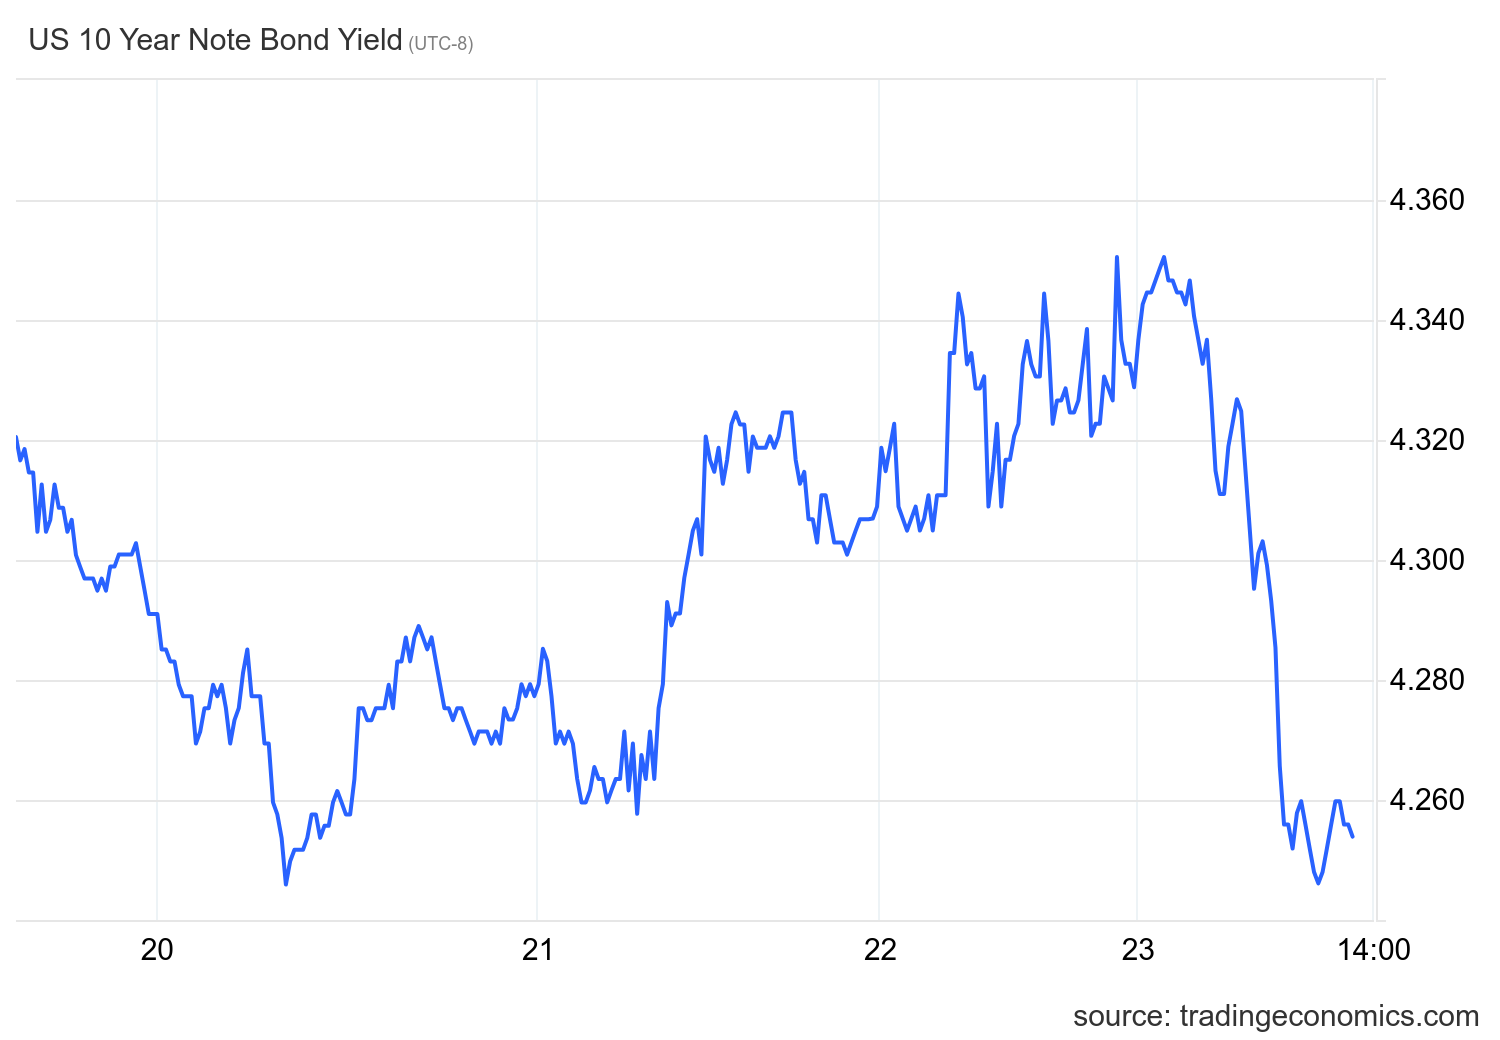
For those who have followed my travails with the 10-year yield over the past year, you know that the 4.34% has been a critical level for me up and down in the merry-go-round world of tracking rates. If we break above this level, the Fed is playing with fire again like it did last year and the 10-year yield can shoot up to 5% again — putting 8% mortgage rates in play again. Even with a lot of hawkish Fed talk last week, we still haven’t broken above that level.
One part of my 2024 forecast has been wrong so far this year: I forecast that if the 10-year yield reached 4.25%, mortgage rates would hit 7.25%. That hasn’t happened. The 10-year yield went above this 4.25% level briefly, and the highest mortgage rates got was 7.16%. This is because the spreads are doing better this year; if the spreads were average, mortgage rates would be lower.
For the 10-year yield, breaking above 4.34% is a big deal. Also, getting below 3.80%, another critical level for the 10-year yield, will be a big deal. As discussed in a recent HousingWire Daily podcast, we would need softer economic data or a real Fed pivot for that to happen. You can see in the chart below why I suspected the bond yield wouldn’t get much lower than 3.80% after that massive move from 5%. If the economic data was getting softer, then yes, that is one thing, but that hasn’t happened yet.
Mortgage rates were lower in late 2022 and early 2023 with a higher inflation growth rate and the Fed still hiking because the bond market anticipated a Fed pivot or a recession, neither of which happened. Remember, the macro data and Fed expectations run a lot of this. This is why I believe in talking about 10-year yield channels for every year and not a single mortgage rate forecast.
For now, the economic and labor data is holding up, so we are still here with 7% rates. In this recent podcast, I discussed why I don’t believe the Fed will pivot housing here.
Weekly housing inventory data
My favorite housing data line for 2024 has been seeing the increase in inventory year over year. I firmly believe that housing inventory can grow over time when mortgage rates increase and we see weakness in demand. The trick is keeping rates higher for longer for that to occur, because once rates fall, the inventory growth story is gone.
Here is a look at inventory last week:
- Weekly inventory change (Feb. 16-23): Inventory rose from 494,029 to 497,608
- The same week the previous year (Feb. 17-24), Inventory fell from 437,282 to 430,395
- The recent inventory bottom was in 2022 at 240,194
- The inventory peak for 2023 was 569,898
- For context, active listings for this week in 2015 were 958,304
New listings data
New listings data is growing year over year and increasing week to week, but I wish we were seeing more significant growth. As mortgage rates rise, there is weakness in demand and homes don’t go into contract immediately. This data line can grow faster as long as people still list their homes weekly.
Weekly new listing data for the last week over the previous several years:
- 2024: 51,381
- 2023: 44,864
- 2022: 48,979
For some historical reference, during 2008-2011, new listings data was growing between 250,000-400,000 per week.
Price-cut percentage
Every year, one-third of all homes take a price cut before selling — this is a traditional housing activity that happens every year. However, this data can move stronger in either direction when mortgage rates rise or fall aggressively.
The year-over-year price data has been stabilizing since Nov. 9, 2022. Even with 8% rates last year, the data was negative year over year, and we are still showing a decline year over year. As rates increase and the seasonal inventory increases, the year-over-year price cut data should increase versus 2023 levels as more supply enters the marketplace and purchase application data is trending negatively.
Here is the price cut percentage for the last week over the past several years
- 2024: 30.4%
- 2023: 31.1%
- 2022: 18.3 %
Purchase application data
We are seeing a similar pattern in the purchase application data to last year: when rates rose in February, purchase application data declined. Last week mortgage rates rose from 6.63% to 7.16%, ending the week at 7.08%. That’s created four straight weeks of negative data, similar to last year. This means the recent existing home sales report that showed a bounce is already too old.
Since November 2023, we have had eight positive and four negative purchase application prints after making holiday adjustments. Year to date, we have had two positive prints versus four negative prints. We are seeing a carbon copy of what happened in 2023, which means it’s hard to get real sales growth even working from the lowest sales levels ever. This is why last year, I talked about how the housing market really revolves around the 10-year yield.
The week ahead: Housing data and the inflation report
We have a bunch of housing reports this week, including new home sales, home price index reports and pending home sales. Pending home sales will be interesting because purchase apps have been weaker, so they should decline. If they don’t, they will be pushed into next month. Sometimes, old monthly data lags current forward-looking data by a month or two.
However, the Fed’s main inflation index, the PCE inflation report, will show that the inflation growth rate has cooled down from the pandemic’s peak but is still not good enough for them to pivot. As always, keep an eye out for Thursday’s jobless claims data. That’s the most critical data line we have today.


