
After two record-setting years of mortgage origination volume, the mortgage industry is contracting, sharply. Based on our read of 2021 Home Mortgage Disclosure Act (HMDA) data, we estimate that total originations volume last year was $4.4 trillion. By comparison, we are forecasting total volume of about $2.3 trillion this year, and similar levels over the next two years.
One question that we receive all the time is, “How much overcapacity was there in the industry for this level of volume, and how much more do you think will be cut?” This is a complicated question, but our goal with this column is to provide our thoughts on how one might answer that question.
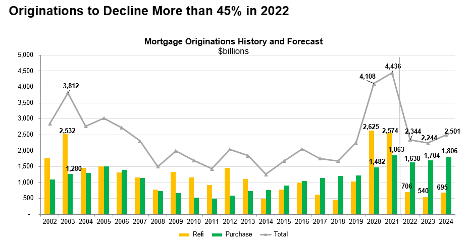
Of course, the world will never stop providing positive and negative shocks. Think back to all that has happened over the last two and a half years. This estimate is only indicative of the path the industry is likely to take, absent a significant change in the level of volume over the next few years relative to our forecast.
Ultimately, the best measure of whether the industry has too much or too little capacity for the volume being originated is profitability. When lenders are in the midst of a refinance wave, margins tend to widen as its all they can do to close the loans coming in the door. As some say during these refinance periods, “the fish are literally jumping into the boat.”
On the other hand, when volume drops sharply as it has recently, pricing gets more aggressive, and fixed costs are spread over a smaller number of units, leading to tighter margins, or even losses.
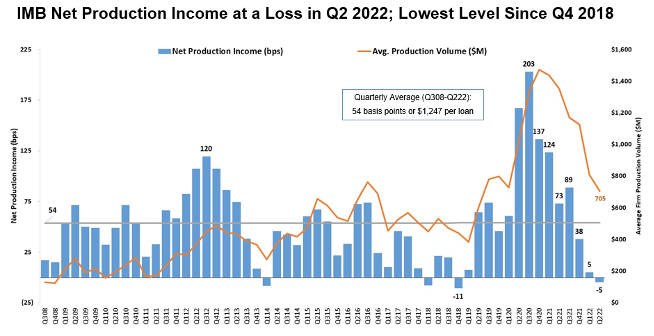
According to MBA’s Quarterly Performance Report (QPR), net production income has averaged 54 basis points since 2008. This production margin reached a record 203 basis points in the third quarter of 2020, as lenders were swamped with refinance volume. In the past three quarters, it has dropped below this historical average.
At 5 basis points in first-quarter 2022, and at a loss of 5 basis points in second-quarter 2022, the industry is now struggling with the perfect storm of lower volume, lower revenues, and higher costs per loan. The net loss at the industry level this past quarter matches the pattern we saw in 2018, with a run-up in rates and the end of a refi wave. Compared to 2018, the current cycle certainly has been more extreme in terms of the rapid spike in rates over a short period of time.
So, one answer on how much capacity needs to come out of the industry is: “enough to experience gain in revenue or reduction in cost to bring margins back to their historical 54 bp average.” We will know that when we see it. But what our questioners are really asking is, “how fast we will get there?,” not just, “where we will end up?”
If industry profitability is the result of having too much or too little capacity, how can we measure capacity directly? We need to examine both the number of employees and their productivity. During the latest refi boom, the hiring cycle was accentuated by constraints caused by the pandemic. Mortgage employee productivity went through the roof as overtime, retention bonuses, and signing bonuses were predominant methods for adjusting capacity.
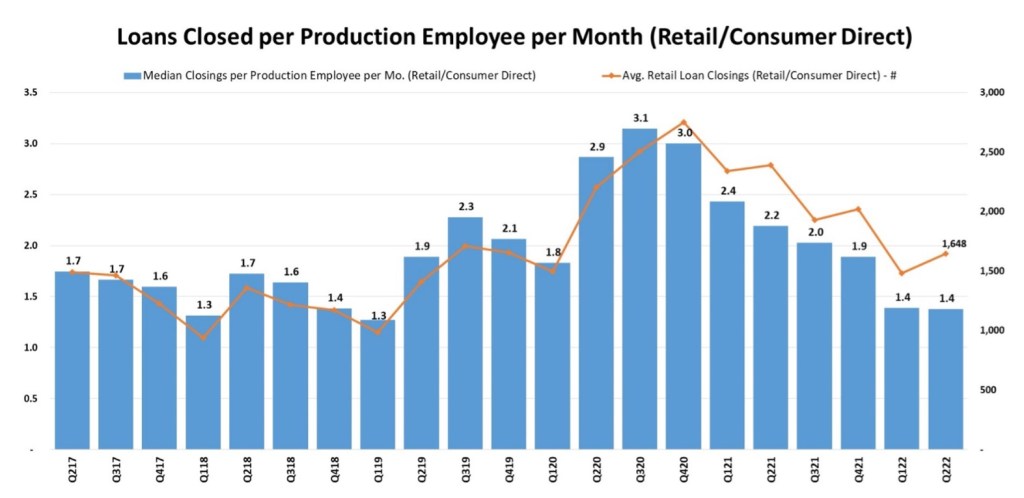
Now, lenders are in a position in which they must reduce their workforces, or risk a plummet in productivity or worse, profitability. Looking again at data from MBA’s Quarterly Performance Report, loans closed per production employee[1] per month (in the retail and consumer direct channels combined) ranged from 1.3 to 2.3 in the three years prior to the pandemic.
That changed in 2020, with productivity peaking at 3.1 in the third quarter of 2020. Lenders talked about how difficult it was to hire experienced personnel during the early phase of the pandemic. Moreover, many lender executives worried that their teams were working too much with very heavy overtime costs.
Given that the lockdowns prevented employees from doing much else, this high level of productivity was not going to be sustainable, even if mortgage demand continued at its record-breaking pace. Per the chart, productivity has since dropped rapidly back to more typical levels as the result of both employee fatigue and, more recently, lower mortgage demand.
But this does raise the question – if lenders had so much difficulty hiring during the boom, does that mean there is less capacity to trim, with this year’s drop in volume? Perhaps so, but that may be difficult to see given the magnitude of the decline in volume.
Layoff announcements are in the news these days and some lenders have chosen to shut their doors. However, to the main question we had asked, how much reduction in employment are we likely to see?
First, let’s examine various measures of industry employment.
Perhaps the most used and frequently cited metric for mortgage industry employment is from the Current Employment Statistics (CES) program at the U.S. Bureau of Labor Statistics, which collects industry data on nonfarm employment, hours worked, and earnings of workers on payrolls during the data collection period.
The monthly Employment Situation Summary news release based on the CES data is regarded as a key report in gauging the health of the overall job market. The monthly data on payroll counts are broken down by the type of establishment and the occupations within a particular industry. [2]
For mortgage industry employment, the estimates are based on two main industry categories. The first category is real estate credit, which covers most establishments focused on lending with real estate as collateral. Examples of companies within this category include mortgage companies, reverse mortgage lenders, and home equity lenders. The second category is mortgage and non-mortgage brokers, which includes establishments that facilitate lending by bringing borrowers and lenders together.
These broad categories include jobs that involve lending directly or supporting real estate lending, but do not specifically focus on mortgages. For example, within these firms, there are occupations such as loan officers, loan interviewers, title-related occupations, and loan counselors that could apply to both mortgage and non-mortgage lending.
Additionally, mortgage employees at establishments whose primary classification is not real estate credit are omitted from these counts. Specifically, industry categories for depository and non-depository credit intermediation do not fall under real estate credit but are too broad to include in the overall mortgage industry headcount.
These establishments are engaged in the lending of cash and extending credit, which also includes some mortgage companies and mortgage lending operations of depositories, but inclusion of these industry categories would lead to an inflated count. It is also unclear in the BLS data how mortgage loan servicing personnel are categorized. Loan servicing is a key component in the life of a mortgage and accounts for a large segment of industry employment.
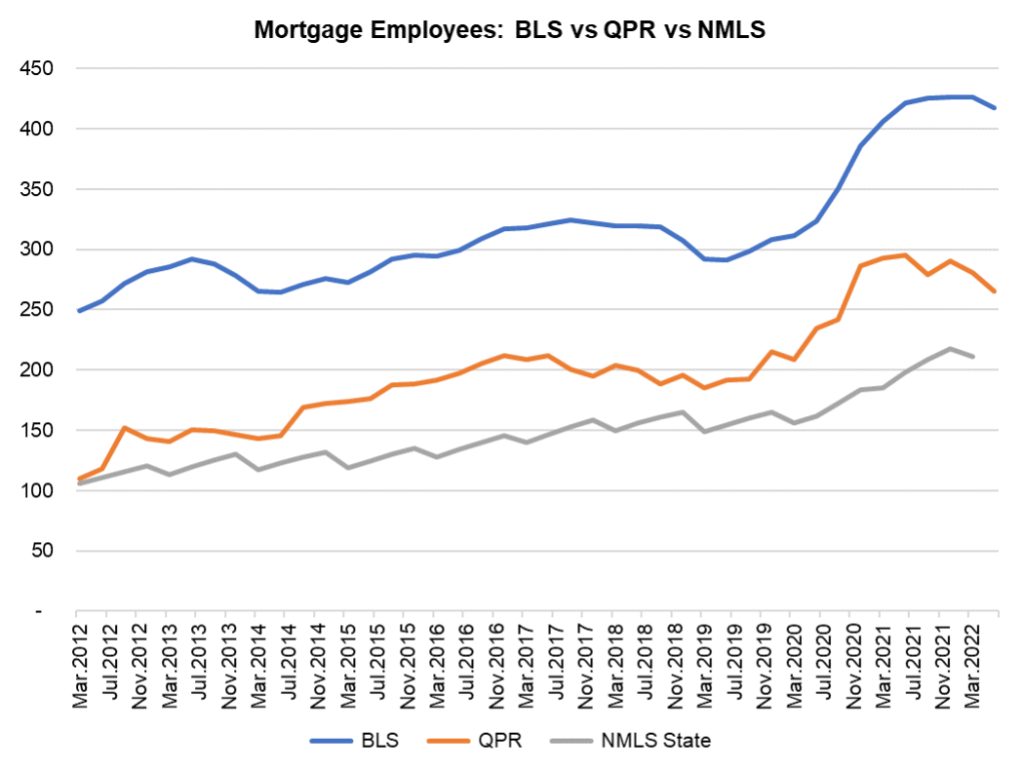
The chart below captures real estate credit and mortgage and non-mortgage broker employment counts from the BLS.
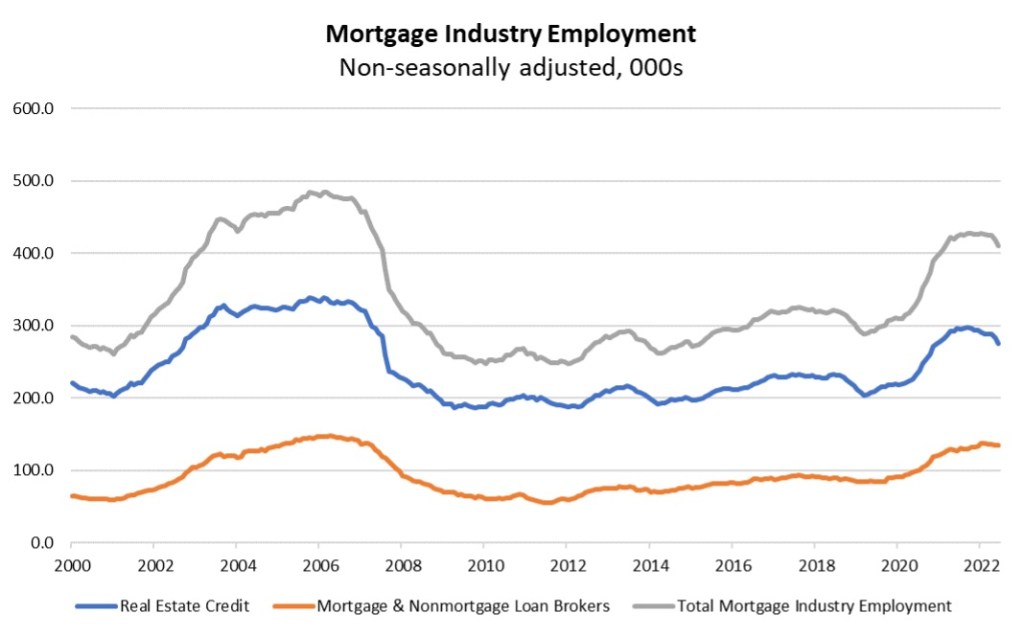
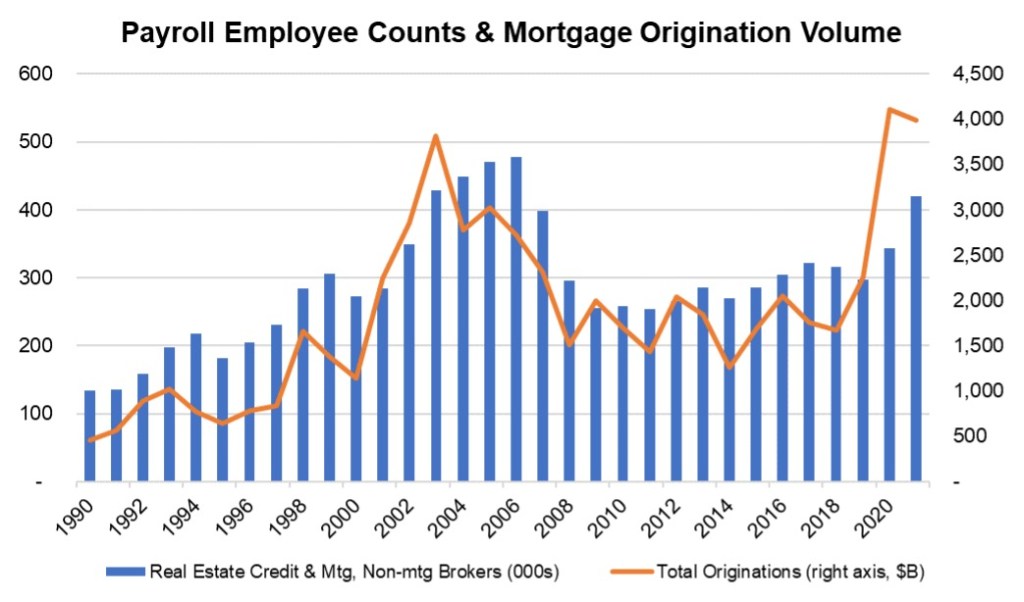
Despite shortcomings in what the BLS data capture, the trends line up well with industry origination volume trends. The first chart below compares annual origination volume to the industry headcount number from the BLS and shows that hiring ramps up in periods of increasing volume and declines in times of lower volumes.
The second chart compares monthly headcounts with monthly index data from the MBA Weekly Applications Survey, which tracks the number of mortgage applications made in a given week. The Market Index has a base period of March 16, 1990, when the index value was 100 and it includes both purchase and refinance applications.
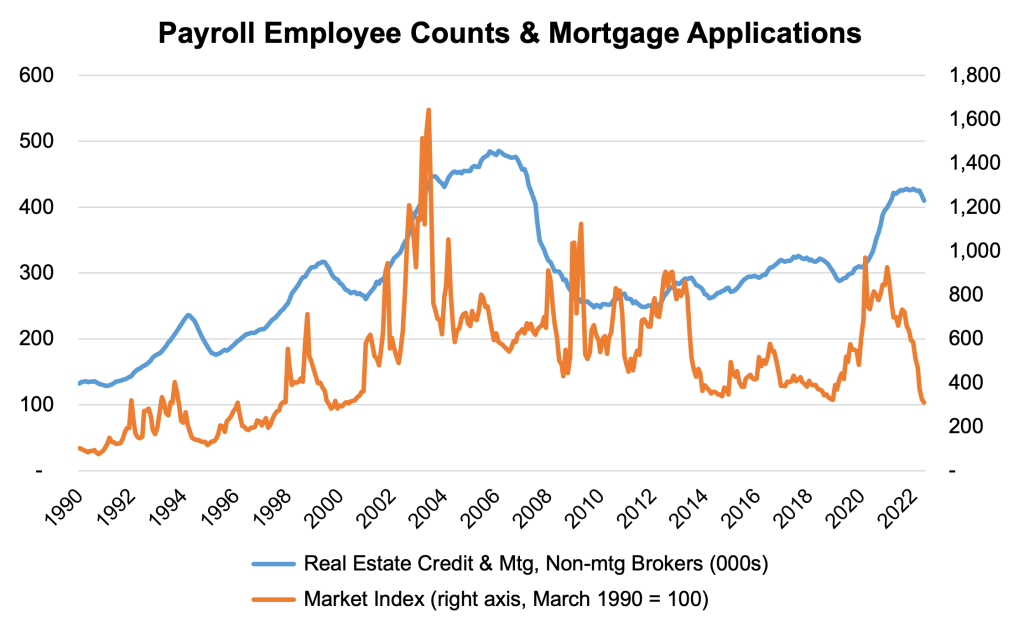
Mortgage application volume has declined 69% from its recent peak in January 2021, as a combination of factors such a higher rates, lack of housing inventory, affordability challenges, and economic uncertainty weigh on both purchase and refinance activity.
We are forecasting that quarterly origination volume will fall from a peak of $1.357 billion in the fourth quarter of 2020 to $467 billion in the first quarter of 2023. Thus far, according to the BLS data, industry employment has already fallen by 4% from a peak of 428,000 in January 2022 to 410,000 in June 2022. And despite the best efforts of the mortgage industry to time their capacity needs perfectly, headcount changes tend to lag volume changes.
A second data source for originator employment that we analyze is the Nationwide Multistate Licensing System (NMLS) owned and operated by the State Regulatory Registry (SRR), which is a subsidiary of the Council of State Bank Supervisors (CSBS). The NMLS was mandated by the SAFE Act following the 2008 financial crisis and is used by non-depositories and depositories for licensing and registration of mortgage loan originators (MLOs)[3].
As of the first quarter of 2022, there were 210,854 individuals who held at least one state license. In total, these MLOs held 885,661 licenses for an average of 4.2 licenses per unique individual. As lenders utilized more call centers and centralized processing facilities in the past decade, the average number of licenses per MLO has increased steadily from almost two licenses in 2012 to more than 4 licenses in 2022.
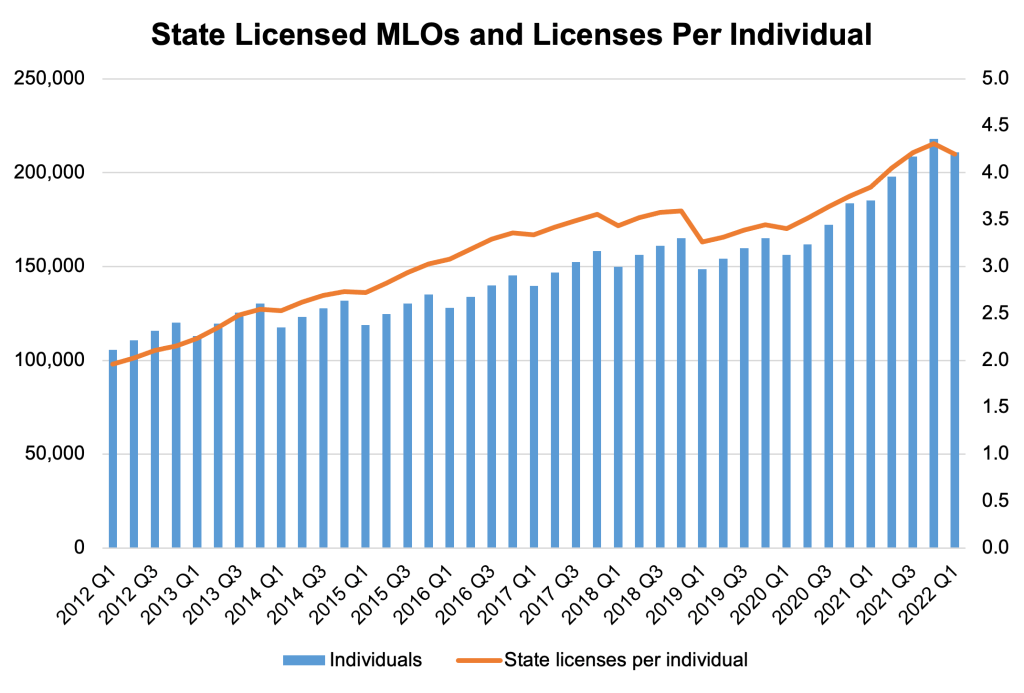
Source: Nationwide Multistate Licensing System
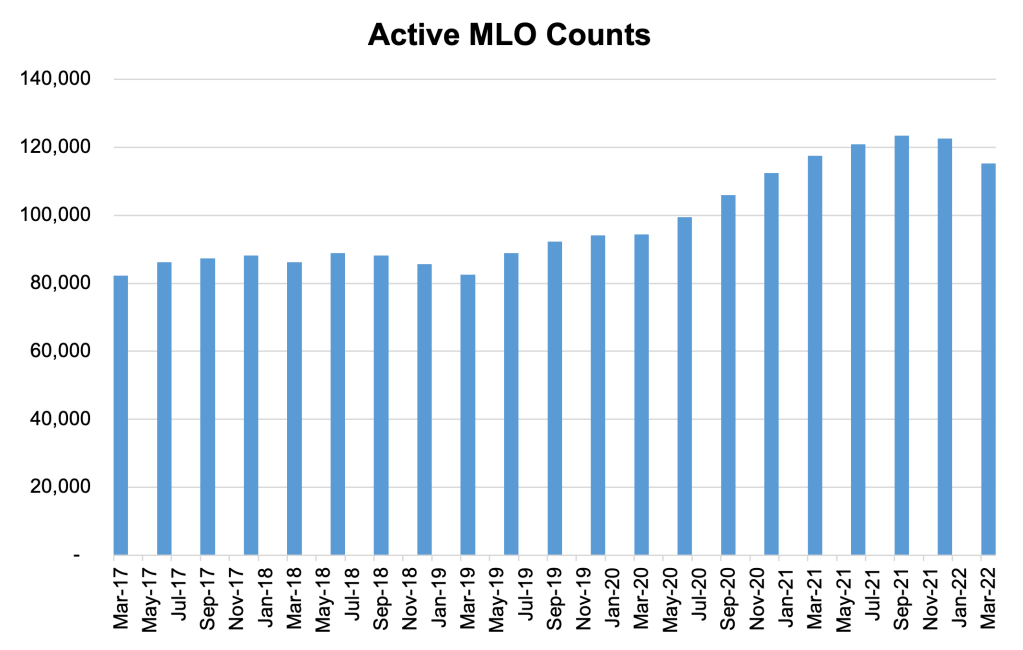
The NMLS also reports how many MLOs are currently active, defined as having originated at least one loan in the quarter. In the first quarter of 2022, there were 115,273 active MLOs, a decline from 122,553 active MLOs in the fourth quarter of 2021, and a peak of 123,479 in the third quarter of 2021. From 2017-2019, the average number of active MLOs was only 87,563.
The NMLS state licensing counts track origination and application trends closely as well, but this too does not account for all the employees within a mortgage operation. There are employees within a mortgage company or mortgage department who are not directly involved with the customer-interfacing loan origination process and thus do not need to be licensed.
While the trends within this data series will be helpful in observing and predicting how hiring might change with industry volume and profitability, we will still need other data sources to supplement our analysis of overall mortgage employment.
A third source we analyze with respect to mortgage industry employment is turning back to the MBA’s Quarterly Performance Report sample of independent mortgage banks (IMBs). We can obtain the total number of employees for those companies, including those involved in production, servicing and corporate admin. The dataset only covers a portion of the industry, but it is a rich sample with over 300 participating companies.
Similar to the NMLS data, while the level of employment captured within this dataset is not for the entire industry, there is still a meaningful relationship between staffing counts and origination volume. The chart below illustrates how these three data sources on mortgage employment compare.
A fourth source of data to measure mortgage industry employment specifically for mortgage servicing is through a combination of other industry benchmarking studies: The MBA and STRATMOR Peer Group Roundtables Program (PGR) as well as the MBA’s Servicing Operations Study and Forum (SOSF). MBA’s industry benchmarking team has estimated industry employment in servicing, utilizing employee head counts relative to volume for large, midsize, and small servicers (both bank and nonbank).
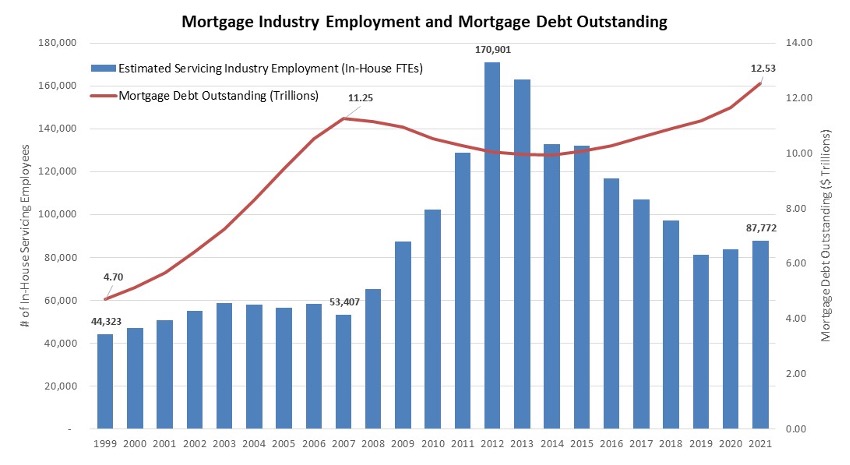
By using the servicing employment levels relative to mortgage debt outstanding per company, then extrapolating to the industry as a whole with historical single family mortgage debt outstanding data, servicing employment headcounts dating back to 1999 were calculated, as pictured in the chart below.
Servicing head counts increased markedly following the Great Recession. During this period of time, more employees were needed to deal with loss mitigation and default tasks as lenders became inundated with seriously delinquent loans. Even after the worst had subsided, sweeping changes in regulatory and compliance requirements and mortgage settlements altered the fundamental ways in which loans were serviced.
As a result, servicing hiring kept increasing even after the height of mortgage defaults. A majority of the growth in hiring was for quality assurance, legal, customer service, default and technology functions to stay abreast of the ever-changing regulatory environment, even as mortgage performance improved and the number of delinquencies and foreclosures declined.
Productivity declined during the period of 2008-2013, then leveled off, making ever-so-slight improvements from 2015- 2019. Despite some improvement, servicing productivity is a far cry from level achieved prior to the Great Recession and the regulatory changes which followed– meaning that more employees are needed even in benign default environments compared to the past.
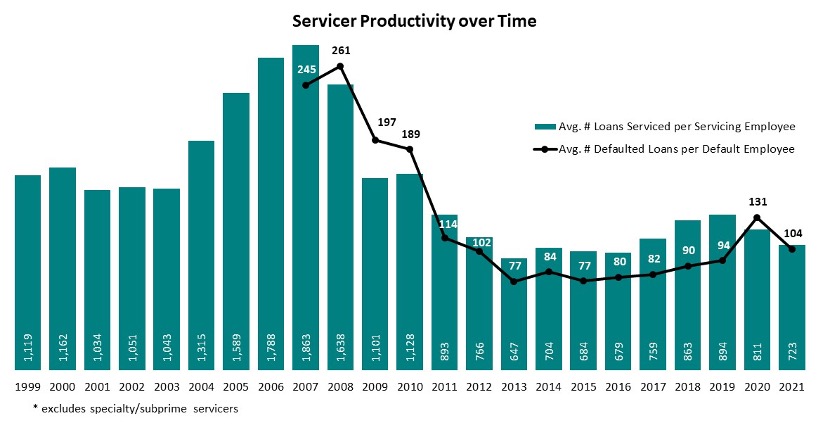
Source: MBA’s Servicing Operations Study and Forum (SOSF)
This becomes apparent when considering MBA’s servicing employment estimate before and after the Great Recession. Prior to that time, total in-house servicing employment averaged around 50,000 employees per year, but that number more than tripled in a span of five years, with the peak of over 170,000 employees in 2012, even as overall mortgage debt outstanding in the market leveled off.
Comparing 2021 to 2007, mortgage debt outstanding rebounded, while servicing employment grew at disproportionate levels, because of regulatory complexities even in a relatively low default environment, and despite that fact that servicing loan count would be closer to 2007 levels were it not for higher loan balances that drove up mortgage debt outstanding.
Based on the MBA’s estimates, servicing employment increased in 2021 relative to 2020, and we can expect that this employment will either hold steady or increase further given the possible slowdown in the economy, increase in unemployment rate from 40-year lows, and in turn, the increase in delinquency rates.
Summing It up
Based on our back-of-the-envelope analysis here, if the industry experiences a 65 percent drop in origination volume from the peak in fourth-quarter 2020 to a trough in first-quarter 2023, per MBA’s forecast, production employment will likely need to be scaled back by 24 to 31%. As of second-quarter 2022, we are only between 2 and 10% there at this point, with the employment data from the QPR showing a bigger drop thus far relative to that from the BLS and NMLS. Servicing employment is likely to be steady or somewhat higher over the next few years, so total industry employment is likely to drop by a smaller percentage.
As noted in the introduction, this is a rough estimate. While another record-setting refi boom is unlikely over the next few years, a recession next year would push rates lower than we are forecasting in our baseline, and likely would push refinance volume up some, which could mitigate the need for some mortgage employee reductions.
[1] Production employee includes sales, fulfillment and production support employees. Excludes corporate overhead employees.
[2]The CES survey is conducted monthly and based on approximately 131,000 businesses and government agencies representing approximately 670,000 individual worksites throughout the United States. “Each month, BLS collects data on employment, payroll, and paid hours from a sample of establishments. To encourage participation in this voluntary survey, BLS uses a variety of collection techniques, tailored to individual firm preferences. Data collection centers perform initial enrollment of each firm via telephone, collect the data for several months via Computer Assisted Telephone Interviewing (CATI), and where possible transfer respondents to a self-reporting mode such as touch-tone data entry, fax, or web collection. Very large, multi-establishment firms’ ongoing reporting is established via Electronic Data Interchange (EDI). Firms using EDI provide electronic files to BLS that include data from all their worksites.” https://www.bls.gov/web/empsit/cesfaq.htm