


The Census report on new construction showed a whopping 22.6% increase above the revised June estimate in housing starts in July. Year-over-year starts are up 23.4%. This means we can add housing starts to our growing collection of V-shaped recovery charts for the 2020 housing market.
From the report:
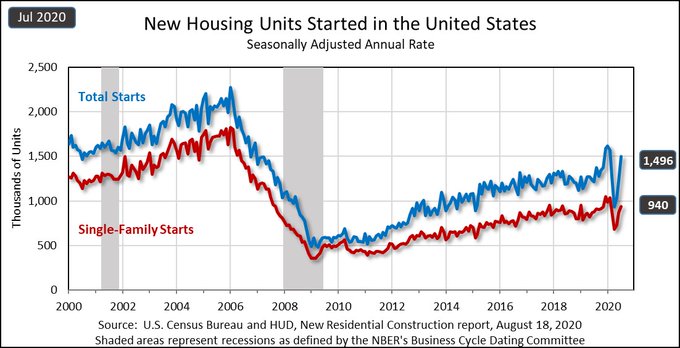
Privately-owned housing starts in July were at a seasonally adjusted annual rate of 1,496,000. This is 22.6% (±14.7%) above the revised June estimate of 1,220,000 and is 23.4% (±12.4%) above the July 2019 rate of 1,212,000.
Single-family housing starts in July were at a rate of 940,000; this is 8.2% (±10.3%)* above the revised June figure of 869,000. The July rate for units in buildings with five units or more was 547,000.
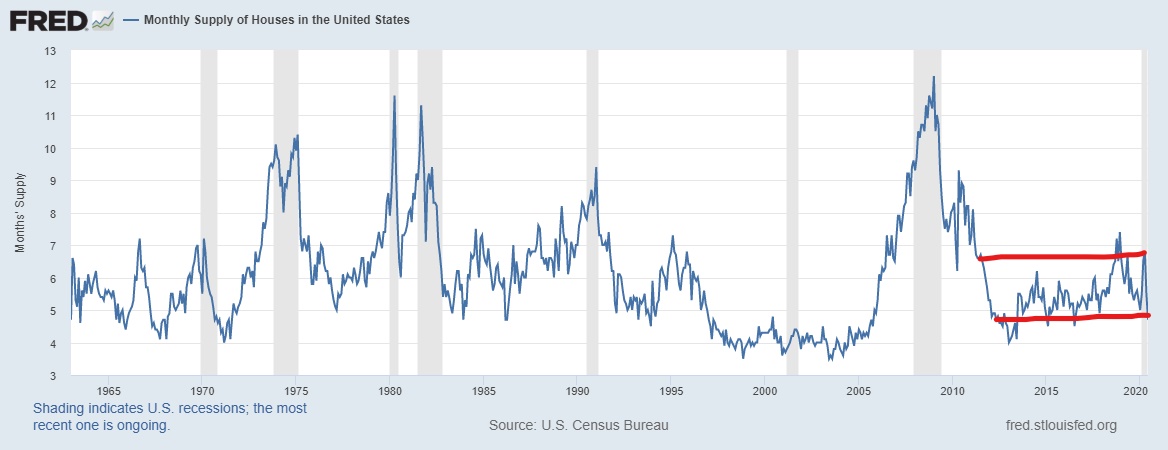
This recovery in starts is a little bit like deja vu all over again. Back in 2018, when builder confidence took a dive, new homes sales were falling and the monthly supply spiked. We spent parts of 2019 whittling down the excess inventory. Because of this, housing starts were roughly flat for the entire year. Rising monthly supply led many housing bears to predict that 2018 was the peak for housing and home prices would next likely crash. I had a different opinion.
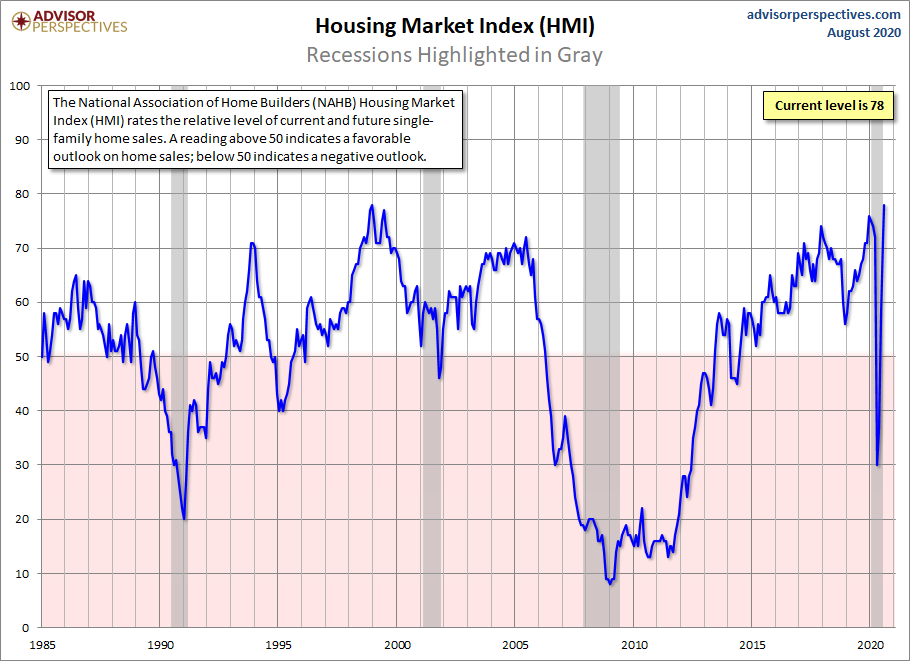
I put the housing sector in the penalty box until the monthly supply for new homes went below 6.5 months. But, I also predicted that in short order housing starts would grow again. In a few months, monthly supply came down and builder confidence rose. In the COVID recovery we are seeing the same thing: builder confidence data collapsed and then recovered in an epic way. So it’s not surprising to see today’s housing starts boom and the monthly supply of new homes back to an area where this type of housing starts data would appear.
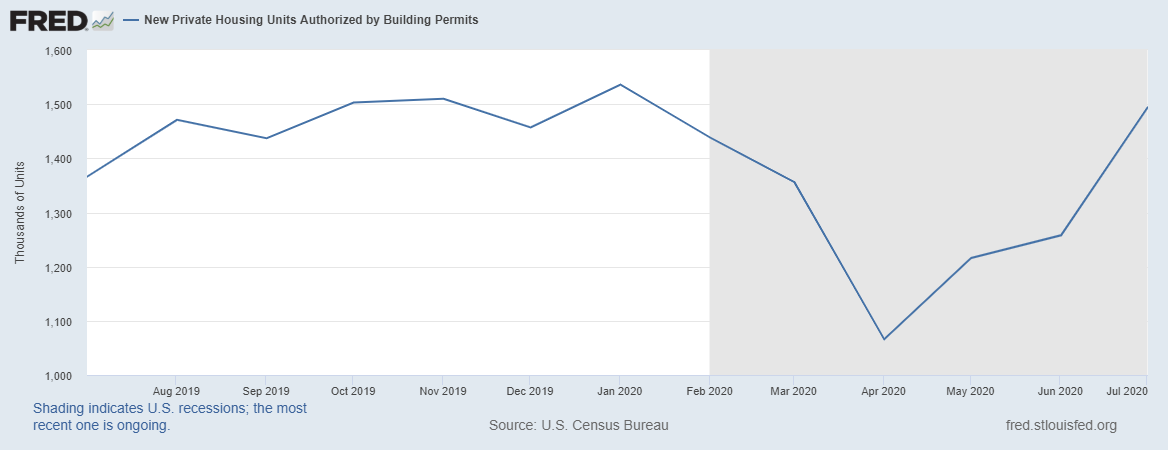
Along with housing starts, housing permits recovered as well.
To understand the housing recovery during the COVID-19 crisis, it is critical to remember that from 2008-2019 we experienced the weakest housing recovery from a crash ever recorded. The years 2020-2024 have the best demographics for housing. Added to this we have the lowest mortgage rates ever. This is essentially the perfect storm for the housing market. This is why housing has held up so well after a brief shock from COVID-19.
Ignore gold bug conspiracy theories who are posting ill-conceived dual axis charts talking about a bubble crash that will happen soon due to forbearance. Even in a year when we had the greatest health and economic shock of our lifetime, housing recovered first. We didn’t need a high level of sales to get demand back on-trend.
The August reports for new and existing home sales will seal the deal on the housing V-shape recovery. At that point, we will need to switch from talking about the V-shaped recovery in housing to a more traditional way of looking at housing data.
We need to take a deep breath, smile at the bubble boys with all their silly bubble crash theories, and start talking about other variables in the housing market. The V-shape charts are done for the most part on housing. While it has been a lot of fun taking the housing bears to the woodshed, we still have much to do to get the total economy back on track.


