


Last week we saw a noticeable slowdown in housing inventory growth that I hope has more to do with a holiday week than a trend. Mortgage rates fell last week after the debt ceiling issues were resolved, but the damage from higher rates took its toll on purchase application data again.
Here’s a quick rundown of the last week:
- Active inventory grew 3,180 weekly, and new listing data fell week to week and is still trending at an all-time low in 2023.
- Mortgage rates fell during the week from a year-to-date high of 7.14% to 6.85% but ended at 6.90%
- Purchase application data had its third straight week of negative data as the constant theme of higher rates impacted the weekly data.
Weekly housing inventory
This year’s growth in active listing inventory has been so slow that I am willing to bet that a zombie from The Walking Dead could outrun it. However, I am grateful we even saw some traditional spring inventory growth this year because new listing data is trending at all-time lows.
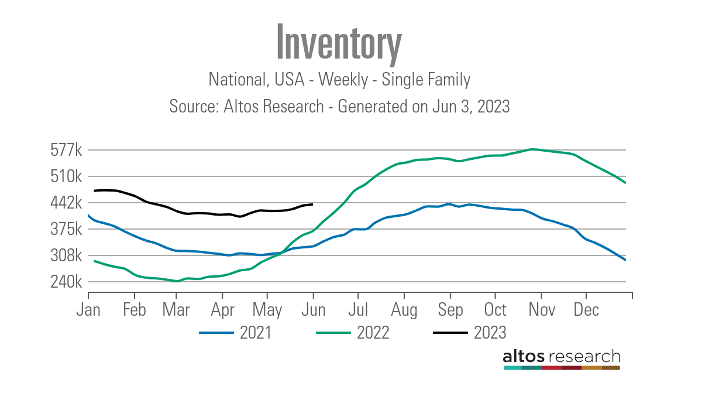
- Weekly inventory change (May 26-June 2): Inventory rose from 433,104 to 436,284
- Same week last year (May 27-June 3): Inventory rose from 357,582 to 368,436
- The inventory bottom for 2022 was 240,194
- The peak for 2023 so far is 472,680
- For context, active listings for this week in 2015 were 1,131,405
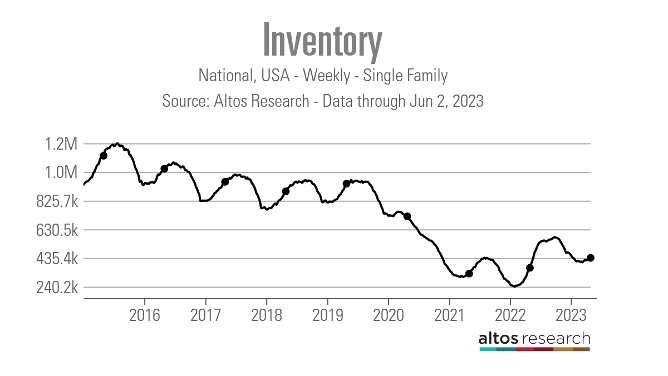
It’s been such a different year for inventory from 2023 versus 2022 that we are heading toward an event that would have seemed impossible in earlier years: If the current inventory trend continues, we will see some negative year-over-year inventory data soon for the weekly single-family listing data.
the chart below shows the clear trend, which is why tracking inventory with rates higher now will be critical to see if there is any way to stop this reality.
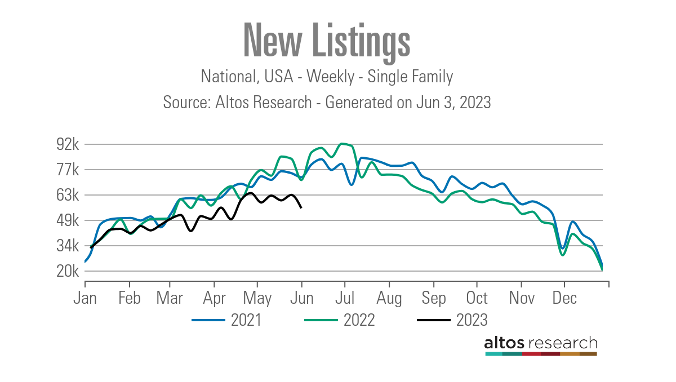
One big reason for this lack of inventory growth has been new listing data, which has trended at all-time lows since the second half of 2022, continuing into 2023. We had another bad week, which I am hoping is due to the holiday. With so few new listings and stable housing demand, it’s been hard getting much of a kick in inventory growth.
Here are the number of new listings for this week over the last several years:
- 2021 72,643
- 2022 71,113
- 2023 55,226
With higher mortgage rates, active inventory should be growing more. This week’s data includes a holiday, so I’m looking for better numbers next week.
Purchase application data
As mortgage rates surpassed 7%, purchase application data had its third straight negative week-to-week print. The only thing that surprised me this time was that I thought purchase application data would actually decline much more than what we saw in the past three weeks. Earlier in the year, the cumulative average of the weekly declines when rates first spiked to 7.10% was -10%. Over these last three weeks, the cumulative decline was -3.93%.
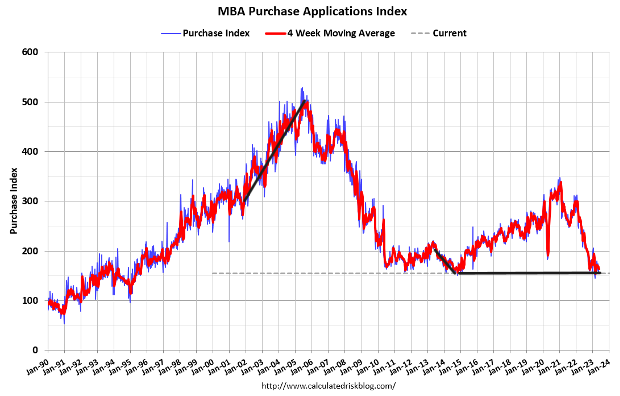
For the year, we are at a wash: after making some holiday adjustments, we have had 10 positive prints versus 10 negative prints. Since Nov. 9, 2022, we have had 17 positive and 10 negative prints. After the big existing home sales report in March, we haven’t had much going on with purchase applications and it will be interesting to see if we get a positive print this week.
Mortgage rates fell and this year purchase applications have traditionally come back with a positive print after a week where the 10-year yield fell, something I talked about earlier in the year on CNBC.
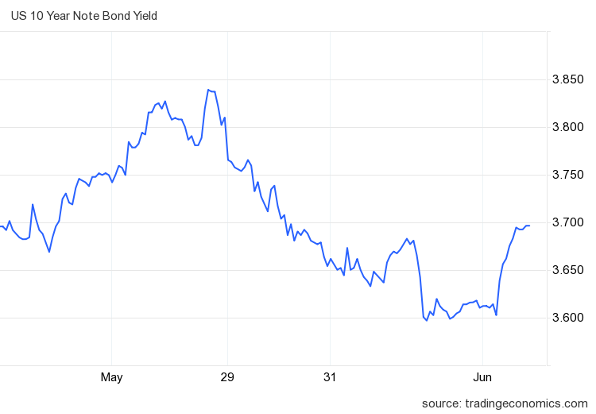
The 10-year yield and mortgage rates
We had a keystone cops week with the bond market and mortgage rates. After the debt ceiling drama ended, we saw a noticeable move lower in bond yields, and rates fell. After the jobs report, the yield increased on Friday, leading to higher mortgage rates.
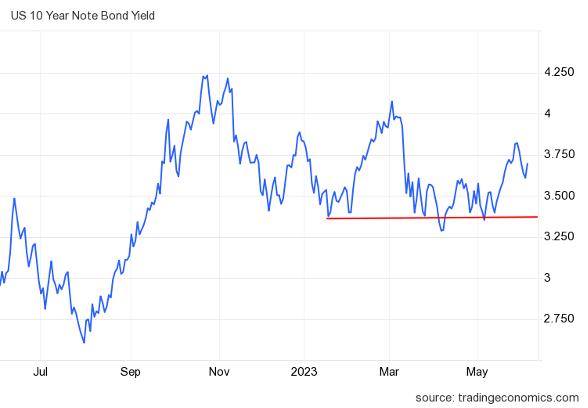
In my 2023 forecast, I wrote that if the economy stays firm, the 10-year yield range should be between 3.21% and 4.25%, equating to mortgage rates between 5.75% and 7.25%. I have also stressed that the 10-year level between 3.37% and 3.42% would be hard to break lower. I call it the Gandalf line in the sand: “You shall not pass.”
So far in 2023, that line has held up, as the red line in the chart below shows. Mortgage rates have been in the range of 5.99%-7.14%. However, we do have some issues in the mortgage market.
Since the banking crisis started, the spreads between the 10-year yield and 30-year fixed mortgage rates have gotten worse, keeping mortgage rates higher than usual. This has been going on for some time, but the spreads were getting better before the banking crisis started and the Federal Reserve went into emergency clean-up mode.
Getting better spreads can send mortgage rates back to the low 6% level without any help from the bond market. However, there is no sign of that happening anytime soon.
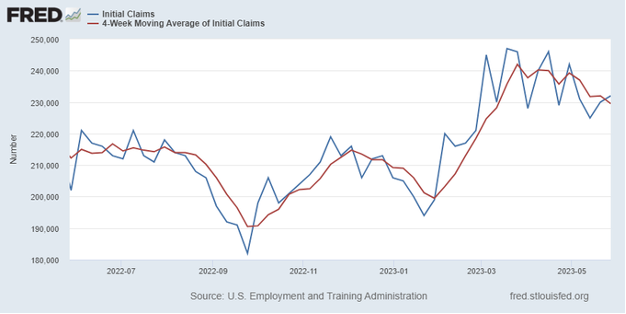
Another aspect of my 2023 forecast was that if jobless claims break over 323,000 on the four-week moving average, the 10-year yield could break under 3.21% and head toward 2.73%. This would send mortgage rates significantly lower than we have seen in 2023 if the spreads improve.
From the St. Louis Fed: Initial claims for unemployment insurance benefits increased by 2,000 in the week ended May 27, to 232,000. The four-week moving average declined, to 229,500.
The week ahead: A light economic week
This week doesn’t have much economic news, just the traditional purchase application data and jobless claims with some ISM reports. However, we should have some exciting bond market auctions after the debt ceiling drama ended since the government was running on fumes and needed to issue bonds to pay the bills. Also, it will be interesting to see how the bond market reacts after the last labor report, which I wrote about here.
OPEC is making one of its occasional cuts in oil production because a few countries need oil prices to be above $83 a barrel to make the math work for their budgets. We’ll see how the market responds to that. However, outside of that, we will be tracking to see if the lower mortgage rates helped the weekly purchase application demand data, and, hopefully, inventory growth will pick up this week.
As we get closer and closer to July 4th, I will be keeping an eye on the new listing data, as we are getting closer to the time when we start the seasonal decline in new listing data since we are trending at all-time lows already. the last thing I want to see is this data line take another leg lower toward the end of the year.


