2021 was supposed to be different. In the first days of the New Year, we have been dealing with a new strain of COVID, vaccinations aren’t going as planned and the political drama is hotter than ever. It is starting to seem like 2020 all over again.
But things are different. On Jan. 5 the 10-year Treasury yield broke 1%, and on Jan. 6 the 10-year remained above that line in the sand even with the storming of Capitol Hill. America’s fight against COVID-19 still presses on, but we do see the light at the end of the tunnel.
This 10-year yield milestone is important to keep in mind when we look at the housing data in the coming months. The housing data in late 2020 went parabolic by some measures and now it should moderate to a normal trend. But unless we see noticeable hits on forward-looking indicators of demand, like the MBA purchase applications, we shouldn’t interpret the moderation of housing sales metrics as anything other than going back to trend.
When tracking MBA purchase application data as a means of determining demand in the marketplace, my usual recommendation would be to only consider the year-over-year data from the second week of January to the first week of May. The data from this period provides an excellent snapshot of the market as a whole for the year. At least, this would be true if last year could be considered a “normal” year for the market, except it wasn’t.
Since 2020 was by no measures typical, including for the housing market, I provide here some considerations to take into account when interpreting the year-over-year purchase application data for 2021 that take into account how significant the effect of the COVID crisis was to this metric.
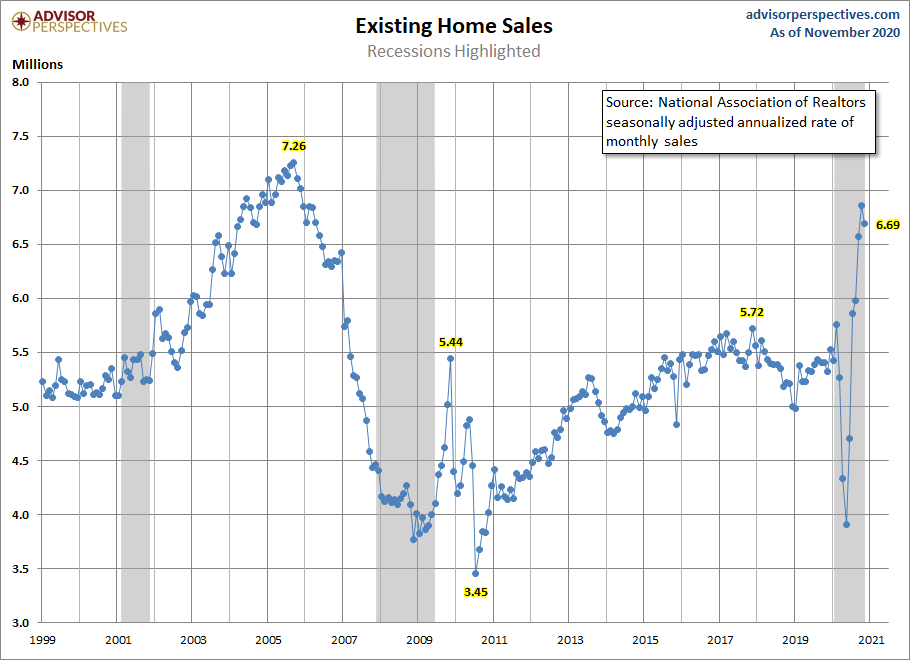
First, when considering the purchase application data for the first 2.5 months (approximately) of 2021, remember that 2020 started off strong. Last year we had year-over-year growth of around 10% in purchase applications each week up until March 18. We did not have growth like this in 2018 or 2019. This was the first real breakout sales data in housing we had seen in a long time, as the February existing home sales report came in at 5,760,000.
For 31 straight weeks, from the end of May to before Christmas, purchase applications were trending at over 20% growth year over year. This strong growth was due to demand that was stalled during the nine weeks in 2020 when purchase applications went negative year over year. In other words, this was make-up demand and we can’t expect this trend to continue. I don’t believe that when the data normalizes we will see 20% growth trends.
But, if in the early part of 2021 we can see 1%- 11% growth in purchase applications, year over year, that would seem correct to me. Above 12% growth early in the year just means that we are still making up for the lost demand we saw last year, something that I have been talking about for many months now.
Tuesday’s purchase application data showed 3% year-over-year growth, but I wouldn’t read too much into that due to the Christmas and New Year’s holidays.
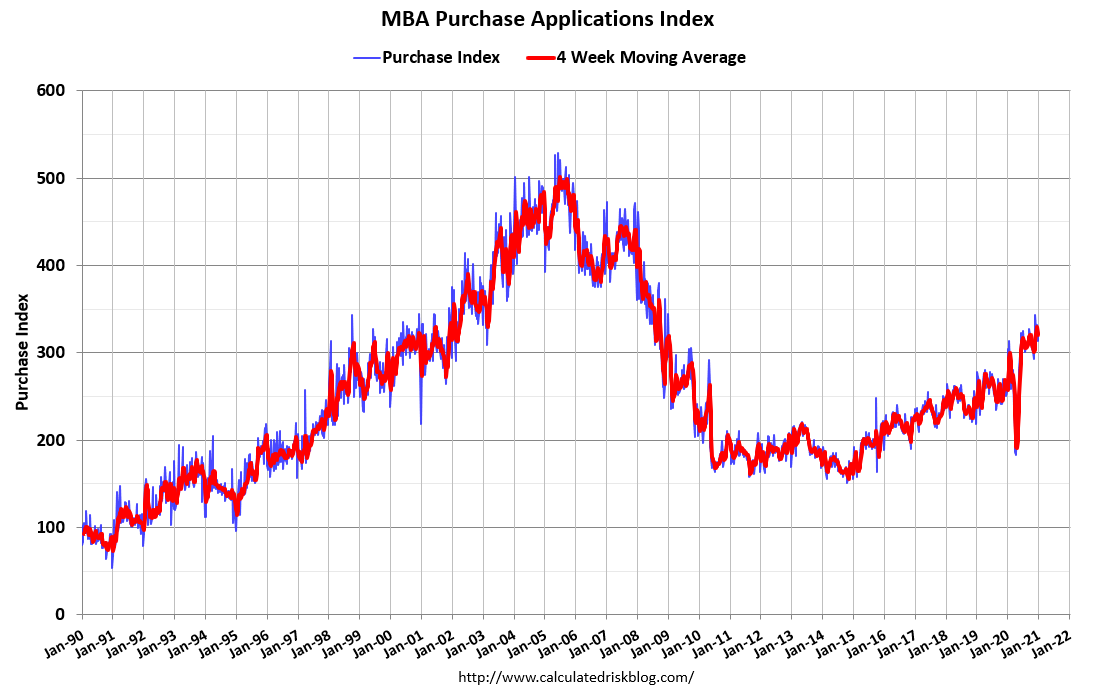
Second, when considering the purchase application data in 2021 for the period after March 18, realize that we are going to see enormous year-over-year growth, especially during the first five weeks of this period. 2020 purchase application data took a waterfall dive during this period due to the shutdown mandates that were imposed in many communities and the simple fear of the virus and what it would do to our economy.
Remember we were hoarding toilet paper and water back then. Some analysts may try to position this year-over-year growth in 2021 as a boom. It is not. Even if purchase application data went down 10% year over year, we will show over 20% year-over-year growth for some of these weeks. Just take that into consideration during that nine-week time period.
Third, when considering the purchase application data for the period of 2021 past the nine negative weeks of 2020 to the end of the year, note that the 2020 comparisons will likely have harder than normal comps all the way to Christmas week. So, yes, we need to know this now, so if we see weaker year-over-year data during the second half, we have some context to go with the data.
The last thing to keep in mind for all of 2021 is that the “too-hot” demand we have had going into 2021 will moderate as that was more a function of make-up demand after the drop in housing data due to COVID-19. This should be expected by everyone. Don’t be like the housing bubble crash boys who, for the last eight years, have taken every soft number (even if the metric was positive year over year) as evidence for their narrative that the housing market is on the verge of a 30%-50% price crash in a calendar year.
Remember, this merry band of forbearance crash bros are professional grifters, not economic data people. I have already seen some of these terrible takes on the recent housing data.
For 2021, I expect existing home sales to have some prints roughly around 6.2 million once the data moderates to a trend. Remember, existing home sales ended the year 2019 at 5.3 million. The February existing home sales data in 2020 showed that if we don’t complete the year at 5,710,000 to 5,840,000 in sales, then COVID-19 not only delayed demand but also erased some of it last year. This will be made up in 2021.
At some point in the future, the data will moderate enough to get a better trend going. Remember, the big theme here is steady, replacement demographic built-in demand while mortgage rates are this low. More information on that can be found in a podcast interview I did recently with HousingWire.