

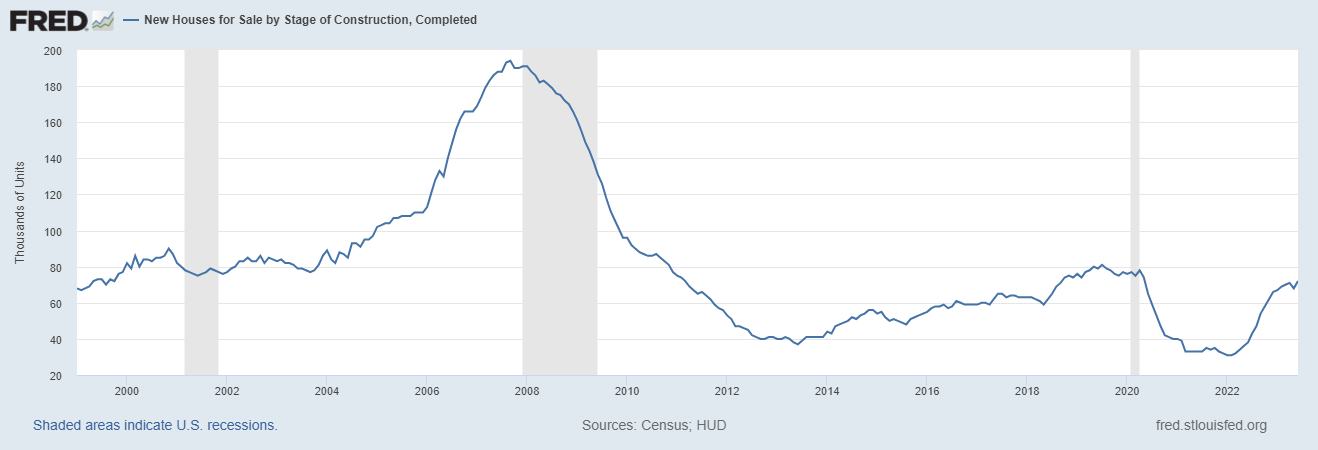
At the Federal Reserve meeting Wednesday, Chairman Jay Powell said more housing supply is coming online. But the new home sales report begs to differ. We only have 72,000 new homes completed for sale in a country of 335 million people, and active inventory is near all-time lows. Where is Powell’s housing supply coming from?
The new home sales market isn’t the best avenue for completed units available for sale and it hasn’t been that way for a long time. Even during the biggest housing bubble crash, we never got to 200,000 new housing units for sale because this isn’t how the new home sales or builders operate their business.
As you can see in the chart below, the ability of this marketplace to provide millions of active listings is impossible.
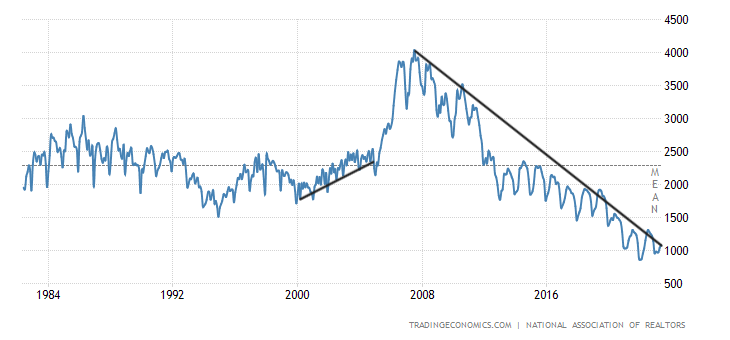
During the housing bubble crash years, active listings grew to more than 4 million in 2007 because most of the inventory in the U.S. comes from the existing home sales market.
NAR active listings data (see chart below):
- 2007: 4 million active listings
- 2023: 1.08 million active listings
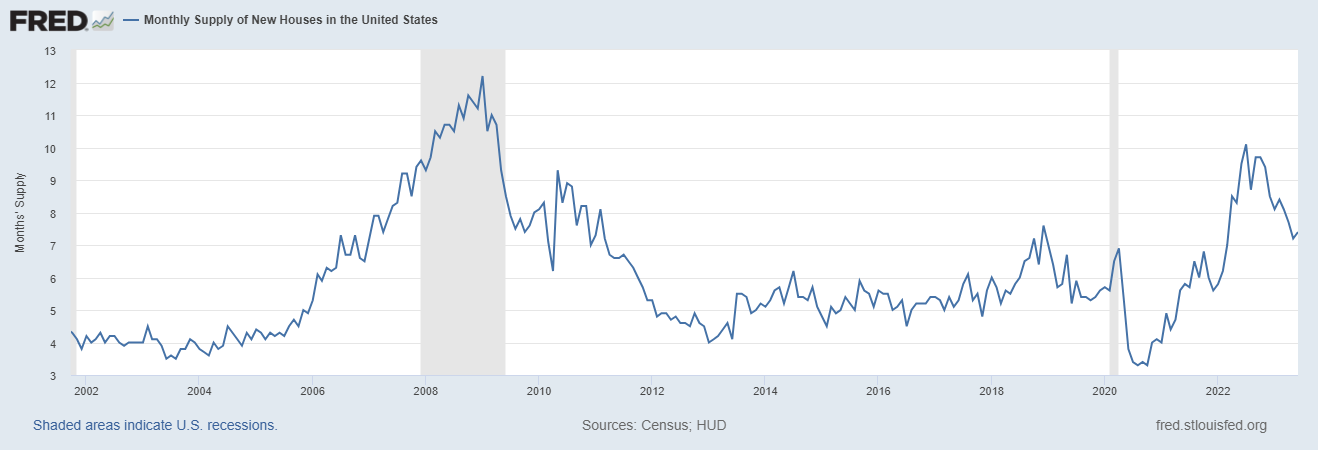
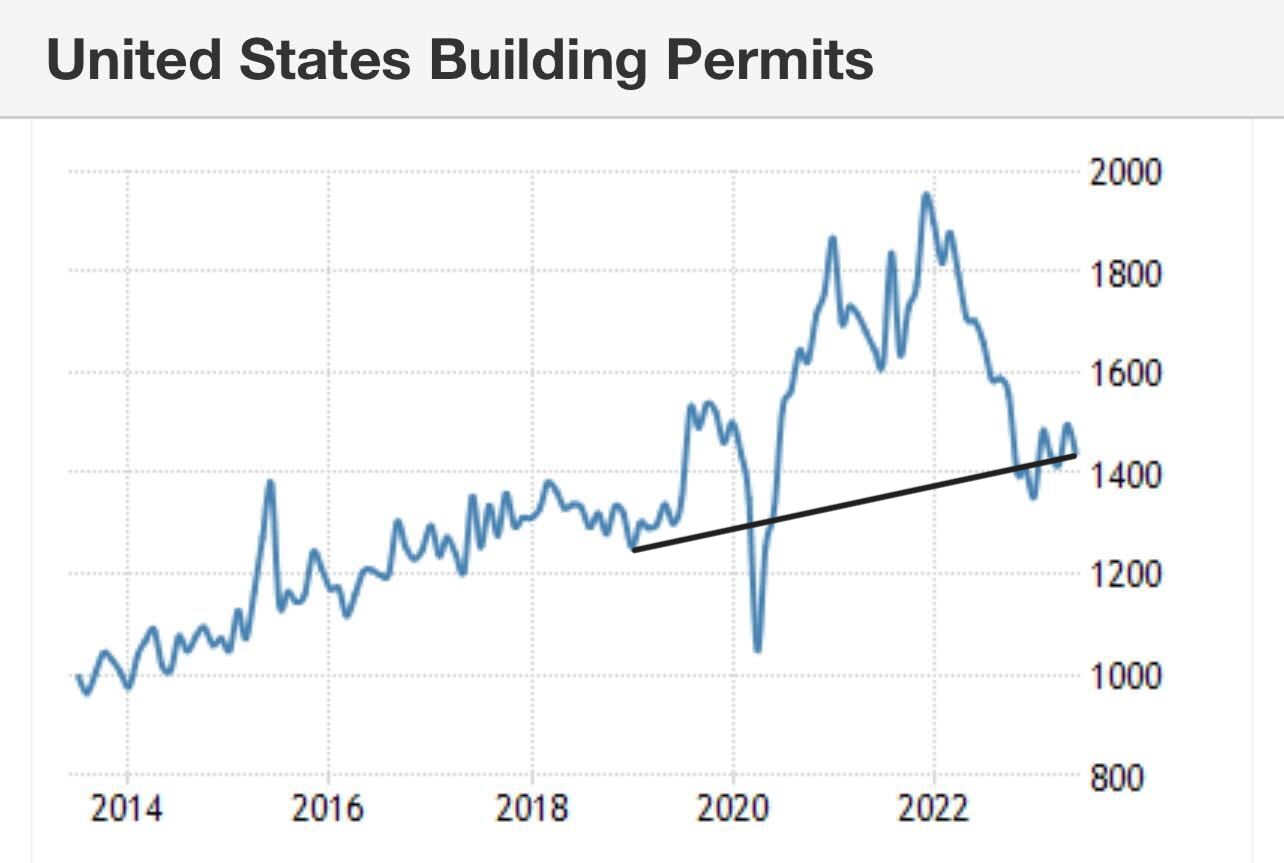
On a positive note, the monthly supply of new homes has been falling from the peak of 10.1 months to 7.4 months, which means the builders are working through their backlog. But 7.4 months of supply, as the chart below shows, is still too much for the builders to get excited about adding to housing permits in a meaningful way.
Now let’s look at the rest of the new home sales report.
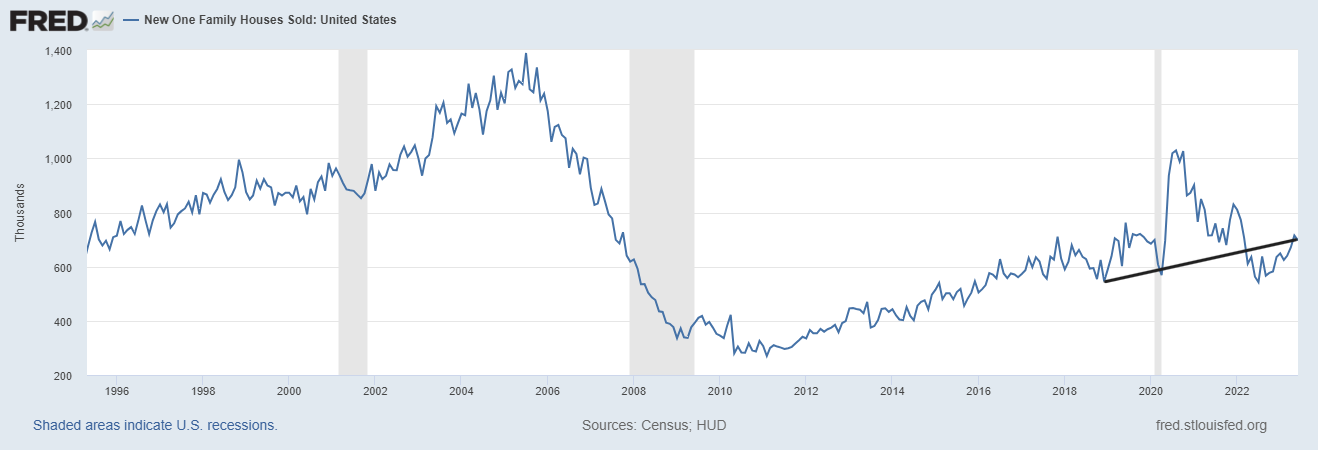
From Census: New Home Sales Sales of new single‐family houses in June 2023 were at a seasonally adjusted annual rate of 697,000, according to estimates released jointly today by the U.S. Census Bureau and the Department of Housing and Urban Development. This is 2.5 percent (±12.7 percent)* below the revised May rate of 715,000, but is 23.8 percent (±22.5 percent) above the June 2022 estimate of 563,000.
New home sales missed estimates and had three months of negative revisions. As always, these reports are wild month to month, so when you see a big print, either negative or positive, it will most likely get revised, so the trend is more important. We saw sales bottom in 2022, and they’ve risen higher ever since.
We have to remember that the new home sales market has some advantages that the existing one doesn’t, which is why we see 23.8% year-over-year sales growth for new homes. The new home sales market is much smaller than the existing one and doesn’t rely on a seller listing their home for demand to grow.
The builders sell their homes like they sell a commodity and they’re efficient sellers — they can cut prices and buy down rates for a smaller marketplace. In addition, the low number of active listings for existing homes makes the builders’ homes a more attractive option. Why not buy a new home instead of an older home that might need a lot of work?
From Census: For Sale Inventory and Months’ Supply: The seasonally-adjusted estimate of new houses for sale at the end of June was 432,000. This represents a supply of 7.4 months at the current sales rate.
It’s always critical to explain how the monthly supply data and numbers work for new homes because I believe a lot of confusion about supply comes from not understanding this data line.
Breaking down the monthly supply data (7.4 months) into different categories is vital:
- 1.2 months of the supply are homes completed and ready for sale, about 72,000 homes
- 4.5 months of the supply are homes that are still under construction, about 260,000 homes
- 1.7 months of the supply are homes that haven’t been started yet, about 100,000 homes
The builders manage their supply like good business people because they want to sell these homes at the highest profit possible and have the margin to spare if they need to make some deals. So, they’re not going to put their heads down.
My model for the builders is simple. To see real growth in permits we need monthly supply to get below 6.5 months with rising sales. We are working our way back to that level but have yet to arrive. We have to remember the builders had a backlog of homes to work off, so we had a pipeline of homes that need to be completed.
Here’s my model to understanding the builders:
- When supply is 4.3 months and below, this is an excellent market for builders.
- When supply is 4.4-6.4 months, this is just an OK market for builders. They will build as long as new home sales are growing.
- When supply is over 6.5 months, the builders will pause on construction.
Overall, this was not the best new home sales report: sales missed estimates and we had negative revisions in the prior three months. But, the trend of new home sales improving using a low bar from last year is still intact.
New home sales are still only at 1995 levels today, so it’s not exactly a booming market. This is why historical sale levels are important when talking about housing demand — we had a very low bar to bounce from last year, and we have. The year-over-year comps for all housing data are about to get much easier since the second half of last year is when home sales were crashing.
No matter what happens to the new home sales market for the rest of the year, I believe Chairman Powell is wrong if he thinks many single-family homes will come onto the market for sale. I mean, if 2023 was his housing reset, he should ask for a refund.


