


The recent action in the 10-year bond yield has puzzled many people, but it looks wonderful to me as it shows that the U.S. economy and housing market are leading the world out of the recession. When I wrote the America Is Back economic model on April 7, 2020, the bond market was already signaling that the economy and housing would be ok.
In addition to the bond market yield action, responsible lending post-2010 gave me confidence that forbearance was not going to be the negative issue that many had hoped for. I coined the term forbearance crash bros last year to show that people who screamed that the housing market would crash in 2020 simply weren’t equipped to talk about housing economics in 2020 and 2021. While lending standards were never tight in American in the 21st century, they were very responsible post-2010.
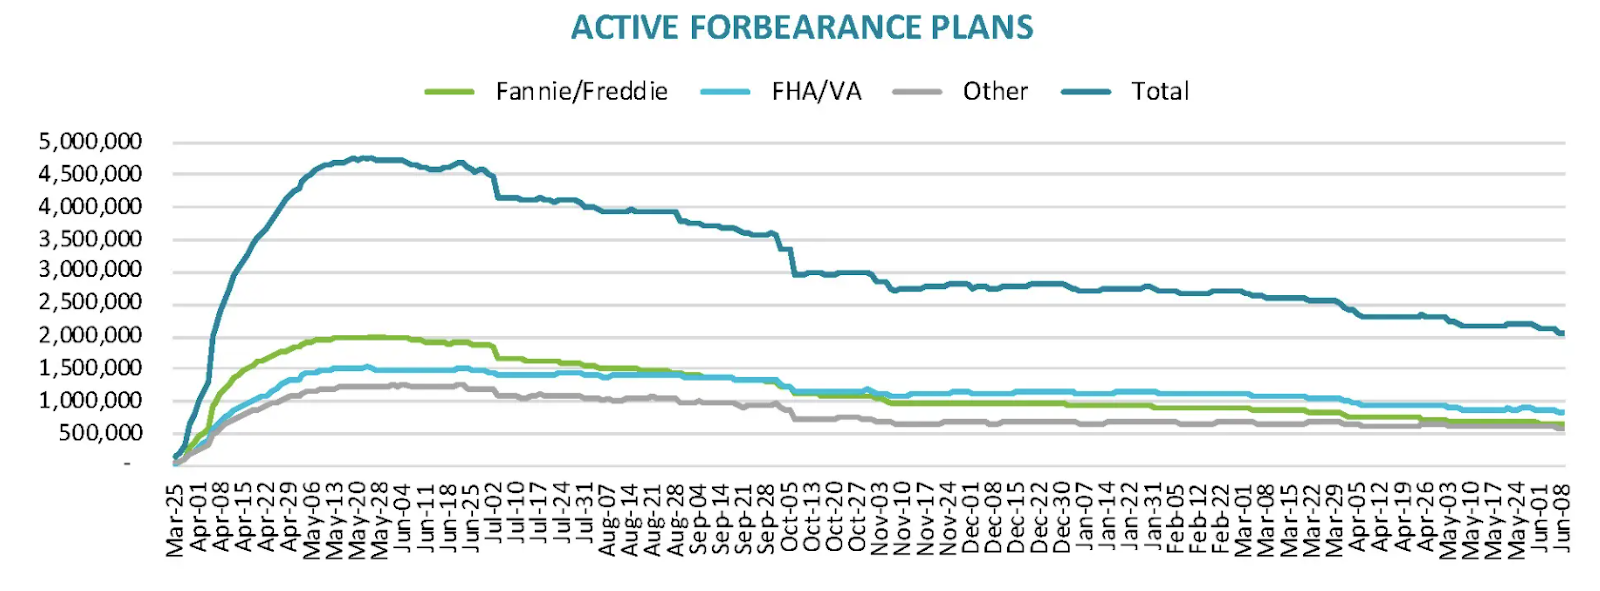
On Friday, Black Knight reported that the number of loans in forbearance are on the verge of falling below 2 million. Roughly one year from the onset of the COVID-19 crisis in the U.S., the number of loans in forbearance programs has fallen by more than half, going from near 5 million to 2 million loans. The number of loans in forbearance peaked early in the crisis and has fallen steadily since late June of 2020, as Americans regained jobs lost due to the pandemic.
The continual decline in the number of loans in these programs may have surprised some people who have been predicting a flood of foreclosures coming onto the housing market and a subsequent massive decline in home prices once the forbearance programs end. More on the convoluted thinking by the so-called “forbearance crash bros” can be found here.
Loans in forbearance keep falling
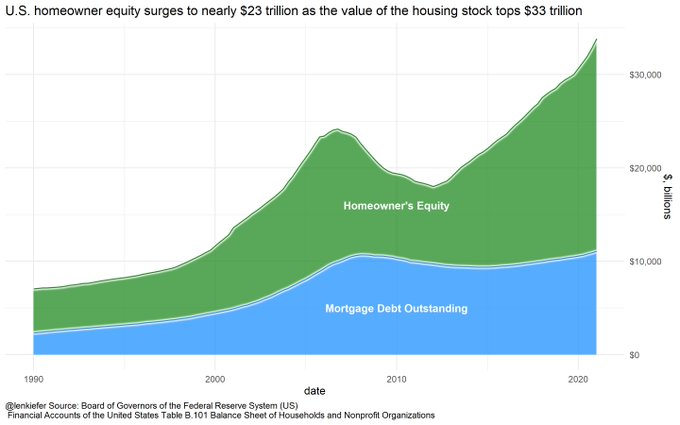
Let’s not forget these people simply always neglected to show the data that Americans had built up a lot of nested equity over the longest job and economic expansion in history before COVID-19 hit us, and that data line has gotten better. Note that you can see that we don’t have much mortgage debt growth from the peak of the housing bubble.
From Freddie Mac Deputy Chief Economist Len Kiefer:
These folks don’t have the training in economics or financial lending, but even so I am sure they don’t believe in their housing crash logic. As professional grifters, it is their job to convince you that the housing market is going to crash despite the facts that following the housing crash of the 2000s, the U.S. had the weakest housing recovery ever and is now entering a period that has the best demographics for home purchasing, during a time when mortgage rates are under 4%.
With these stats, one would think it would be nearly impossible to convince anyone that the housing market is about to have a bubble crash. You gotta admire their gumption. Except I don’t and here’s why.
I have a big problem with these guys trolling the United States of America during a global pandemic when our country is losing people daily. So I continue to harp on the forbearance crash bros. If they won’t take a rest during a global pandemic, then I’m not going to either.
COVID-19 was not an economic crisis. It was a health crisis first, that turned into a chaos theory and the butterfly effect. The recovery process started in April 2020, a month that represented the mother of all lows in America economic data short term.
During that time, there was a lot of uncertainty so some people got into forbearance programs even though they could still afford to make their payments. Needs tests were never part of that process. Even today, there are probably some people in the programs that don’t need to have their payment deferred any longer but are stretching out the mortgage payment vacation as long as they can.
What about the rest of those homeowners with loans in forbearance? Those who purchased a home with a mortgage after 2010 qualified for the loan based on their financial profiles and income. The majority of mortgage holders have good cash flow and a financial profile that improves over time as long as they have a fixed low debt cost versus rising wages.
This is the case for those who took mortgages between 2010 and 2019. Remember, they were building equity all during that time prior to the COVID-19 crisis. Loans that are at risk are those that were started late in the economic cycle, with a low down payment going into a job loss recession, because these loan holders did not have the time to build equity. But even these loans are largely “safe” because we had forbearance programs available and now, before these programs have even ended, jobs are coming back.
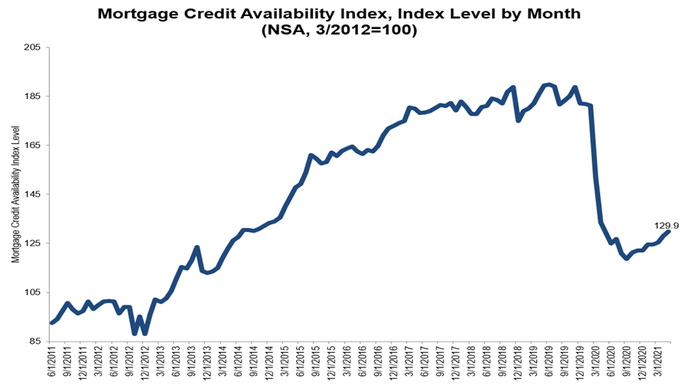
Is credit really getting tighter?
When the crisis started, it looked like credit was getting tighter, per the MBA data line. At that point in the crisis, I argued that less than 6.2% of the loans being done in America were being affected by the availability of credit. Loan originations for both refinances and purchases were solid last year.
Since Freddie and Fannie were in conservatorship during the crisis, credit flowed fine.
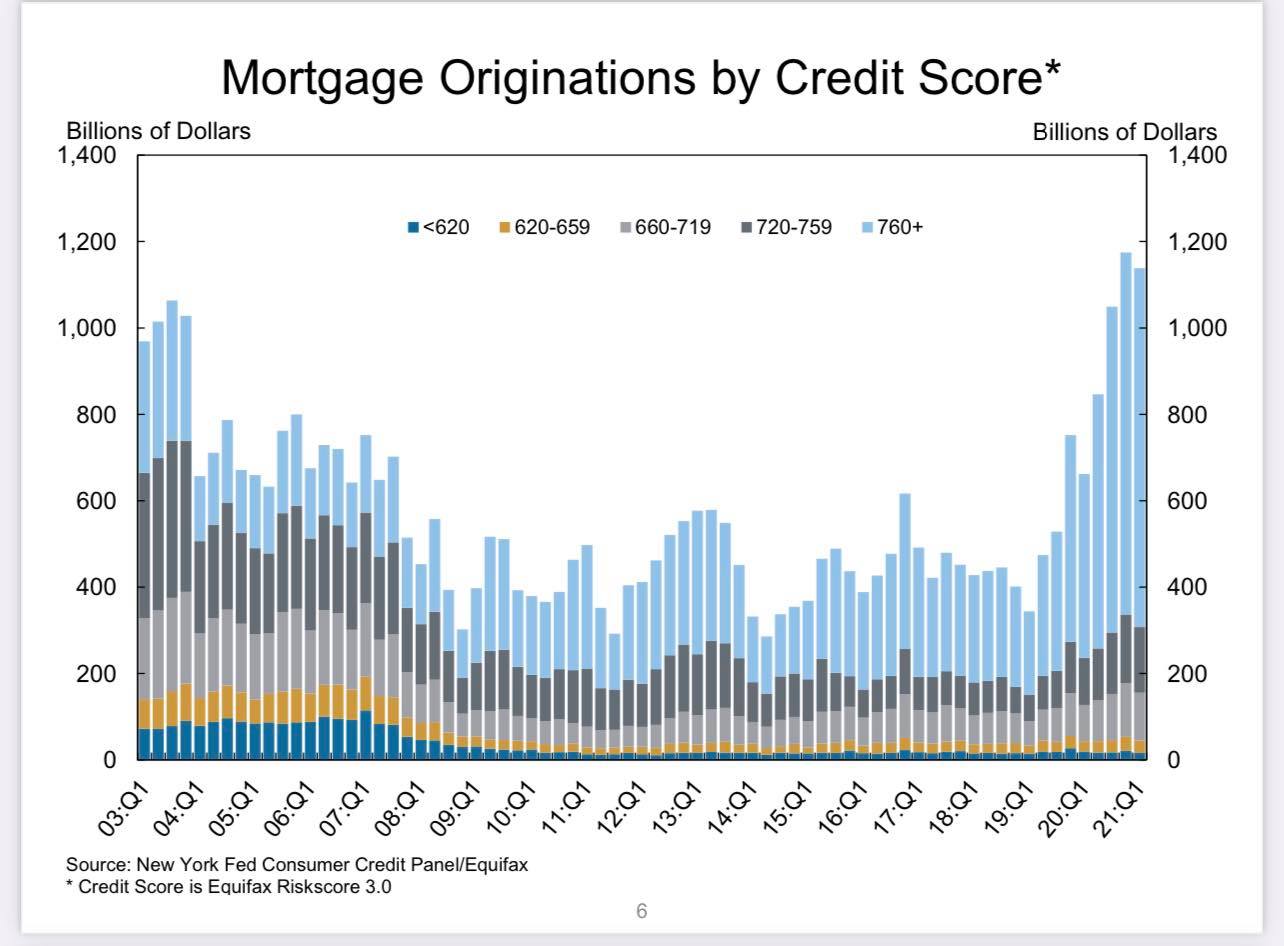
Lending standards have been and still are very liberal. One can purchase a home with a 620 FICO score, a 3.5% down payment and a 43% debt to income ratio. That’s pretty liberal. Credit in big-scale terms was never tight and when the MBA data rises it’s not loosening up credit in any major way either.
After 2010, the structure of loans became very vanilla. No more exotic debt structures and income is verified. This means that Americans who buy homes with mortgages these days are financially capable of owning the debt. Homeowners, in general, have excellent cash flow. In the larger picture this means we have a lot of mortgage holders who have fixed low debt cost in an environment of rising wages, thus more disposable income every year.
The truth is, credit has always been available for home purchases. Credit for home loans has never been tight in this century. It is true that some loan types disappeared after 2006. In order to cure some ills of the housing market, loans with ridiculous risk profiles were no longer offered. However, outside of that, we have always had liberal lending standards in America.
It is because lending standards were solid after 2010 that I knew the housing market would be okay despite the COVID-19 crisis. The main problem with the current housing market, following COVID-19, is not high inventory and crashing prices due to the number of distressed homes but no inventory and unhealthy home price gains.
Since we lend to the capacity to own the debt, we don’t have much wiggle room up or down, and since Freddie and Fannie were in conservatorship during the COVID-19 crisis, credit flowed fine.
Home sales are coming up soon and an interesting report for the existing home sales marketplace. Roughly two and half months ago, I discussed that we should see some current home sales print below 5,840,000, which didn’t happen in the last report. However, I still believe this to be the case based on the purchase application data, and after two of my COVID-19 adjustments, we should see some print below this level.
Remember, total existing-home sales ended 2020 at 5,640,000, and so far, a lot of higher prints we have seen earlier were still make up demand to a degree. Total home sales in 2021 still look to be slightly higher than in 2020. Yes, it is unhealthy that we are seeing a lot of price growth with little home sales growth growth year over year. I recently talked about this and another issue on the Animal Spirits Podcast.
What is going on with the 10-year yield?
A lot of people are scratching their heads on why the 10-year yield is still below 1.60% with such hot inflation data and the strongest economic growth this century.
When the 10-year yield was at 1.47% in 2019, a lot of people were talking about recession. Before the COVID-19-recession, I wrote that should we go into a recession, we should expect to see yields between -0.21% and 0.62%. Historically, these are the lowest yields ever. If yields go above 0.62%, then the bond market is indicating that we are recovering and we are going to be fine. As part of the America is Back economic model recovery, we want to see yields get to 1% in 2020. When yields got to almost 1% in 2020, I counted that as the last milestone in the American Is Back recovery model.
On April 7 of 2020, when I wrote the America is Back recovery model, the 10-year was at 0.73%. I wrote that the bond market was indicating that the economy was going to be better in Q3 and Q4. I totally understand why people thought that I was crazy and that I had lost my mind due to the COVID-19 madness. Sometimes madness is simple belief in one’s model.
What I wrote back then:
The fact that the 10-year yield is at 0.73% while I am writing this tells me that the markets believe that Q3 and Q4 will be better than Q2, which is using the lowest bar in recent history to work from.
An early indicator of recovery would see the 10-year yield above 1% — especially if it got above 1.33%. A range between 1.33% and 1.6% on the 10-year yield is something we should be rooting for, especially if this happens without liquidation selling of bonds.
Once you get to these levels, know that it’s a good thing.
The 10-year yield rose from 0.52% to 0.99% since August of 2020. That rise told us the economy was in recovery. I proposed that the 10-year would live in a range between 1.33%-1.60% in 2021, and that is what we have seen. I was more bullish than anyone last year but even so, I didn’t foresee the 10-year yield going over 1.94%.
If it does, I will throw a huge party, but I’m not buying the party hats yet.
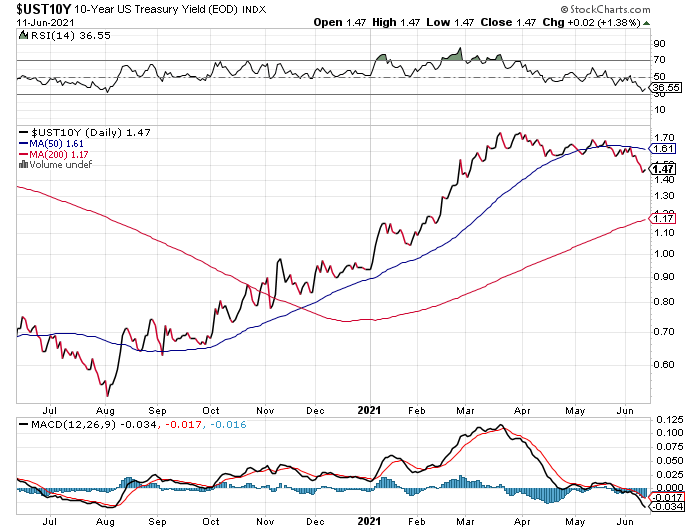
We can have low yields in an expansionary cycle. The rise in yields , even though historically low, also came with the best economic growth in the 21st century and the hottest year-over-year inflation data. Don’t always assume low yields are a bad thing coming out of recession. An increase is an increase and coming off an intraday low of the low 0.30’s on that terrible week in March, 2020, it’s been an epic U.S. recovery. On inflation!
A big theme of mine on Twitter during the expansion was called “The Inflation Playbook.” We can expect that inflationary data will look crazy in the short term but will moderate in time. We had a similar inflationary experience from 2008-2012, but the recovery was much slower then.
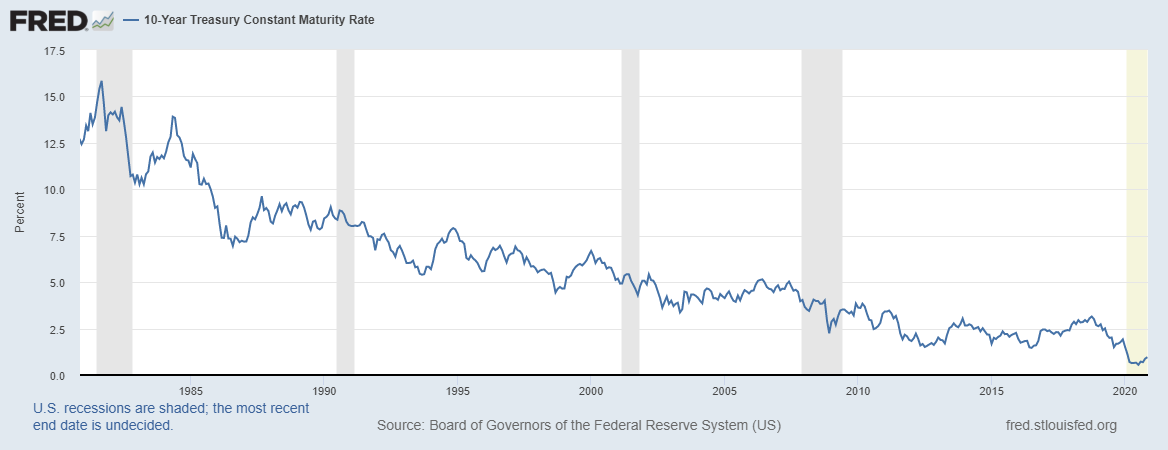
In summary, the 10-year yield is behaving as I expected. In a historical context, I can understand that it is confusing that our best economic growth this century came with yields under 1.60%, but this is the reality of the world we live in with a downtrend in the 10-year yield since 1981.
We should be seeing the second wave of job growth and get all the jobs lost back from COVID-19 by September of 2022 or earlier. That should bring down the forbearance data more. I’m hoping we can get the forbearance data under 1 million next year. America is back, people; this train started in April 2020 and it is bound for glory. Get on board! And cut the hyperinflation nonsense out, leave that dungeon and dragon game back where it belongs — in the basement.

