


With Halloween in the rearview mirror, we still have one more spook to survive in 2020 – and no, I’m not talking about the upcoming election. I’m talking about housing market crash headlines.
The housing data has been wild this year. We’ve seen waterfall declines and parabolic rebounds. These dramatic peaks and valleys have fed the demons of greed and fear that infest the minds of our extreme housing bulls and housing market bears – leading to equally wild speculations about the future of U.S. housing.
With all these dramatic people espousing their housing market takes, how is a reasonable person to know what to believe?
Fortunately, there is a way to stay sane. Following some fundamental housing data trends will keep you on the straight and narrow path of reality and immunize you against the outlandish flights of fancy put forward by our extremist friends.
Take the Pending Home Sales Index, for example. In April of this year, pending home sales had its worst print of the 21st century.
Then two months ago, pending home sales had its best print of the 21st century.
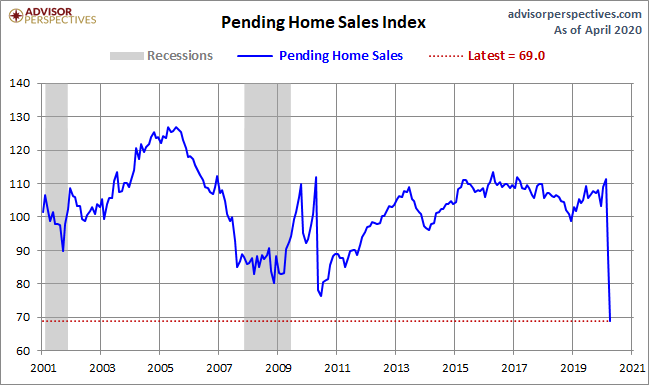
Then, last month we had a tiny pullback.
This slight blip downward at the top of that chart led several people to say there were “cracks” in the housing market. There are several problems with this thesis.
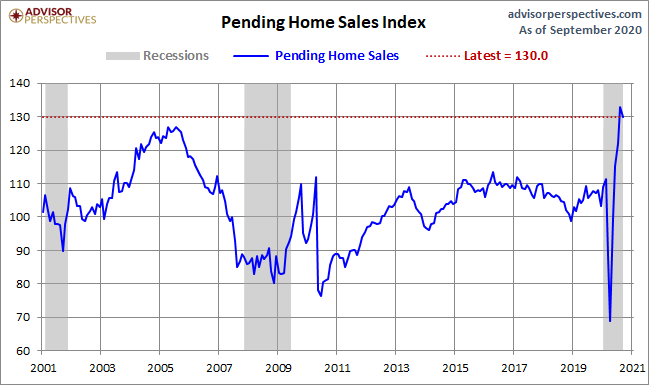
Not the least of these problems is that it’s the second-best print in this century. I think housing data will moderate, but this wasn’t the moderation I’m talking about. Remember, pending home sales are forward-looking and the data is saying that housing demand is still good year over year.
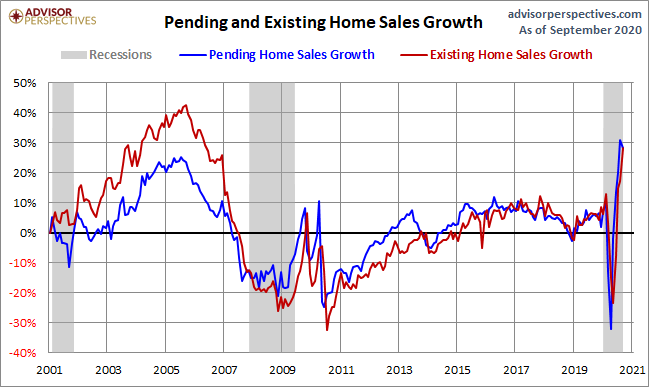
Existing home sales, on the other hand, are not as extreme as pending home sales. Existing homes sales didn’t have either the worst or best print in 2020. The peak in this metric for this century was in 2005, and the real bottom was 2008. The 2010 bottom was the homebuyer tax credit so I wouldn’t count that data point.
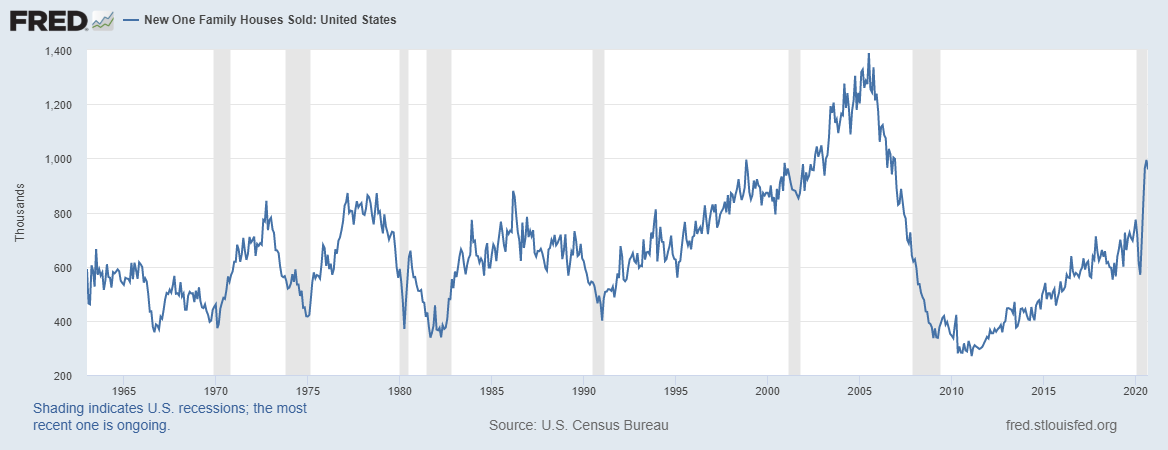
New home sales data has been wild this year. This data line went parabolic, and it almost never goes parabolic. The most recent report had a miss on the headline number and negative revision. However, both of these data lines in the last report are still trending higher than I thought. So, once again, this isn’t the moderation I’m looking for. When looking at this metric, the key takeaway is that big moves, either up or down, tend to get revised back toward trend.
How does one tell when a downward trend in the data is a real sign of a weakening housing market?
Two factors are in our favor. First, we’ve been there before, so we know what to look for, and second, it’s not that complicated. We just need to consider both sides of the housing market – new and existing home sales.
The last time we had a consistent downtrend in existing home sales was back in 2013-2014. During that period, the overall economic data improved, which pushed bond market yields up from 1.60% to 3%. Mortgage rates followed, which dampened demand. Keep this scenario in mind for 2021.
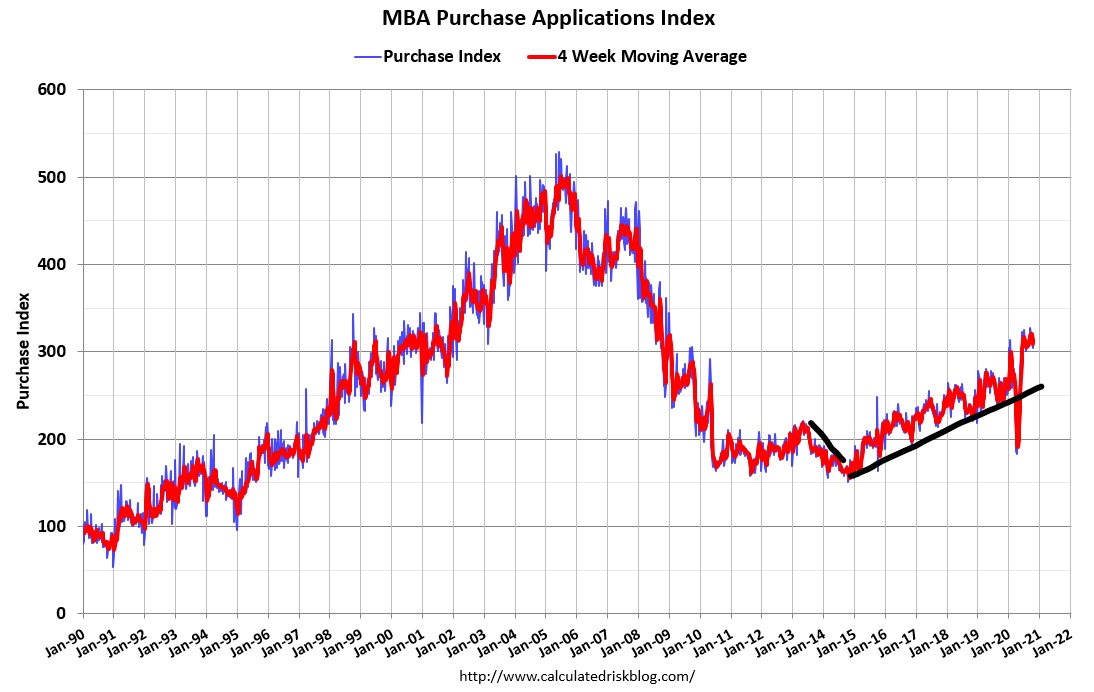
During that same period, the MBA purchase application data was down 20% year over year. This took the index to an all-time low when adjusted to the population. The downward trend in existing home sales over a year was a verifiable sign of weakness in the market. Not an impending crash, mind you, but softness for sure.
We haven’t seen that kind of softness in six months. We saw purchase applications fall apart earlier in the year, but they also made an epic comeback as people weren’t afraid of buying a home anymore. Plus, we have solid demographics and low mortgage rates.
I would need to see the purchase application index move by double-digit in either direction to think there had been a significant change in demand for housing. Before COVID-19 hit, purchase applications were up 10% year over year. After the temporary stall due to the virus and stay-at-home orders, applications have been up, on average, over 20%, year over year, for 23 straight weeks. This data looks out 30-90 days, so if we are still showing year-over-year growth, whether it be at 33% or 3%, demand is sufficient.
I expect to see some moderation in the data, but until applications go negative 10% to 20% year over year, for a year, don’t talk to me about a softening market like we saw in 2014. As of today, in terms of existing home sales, the data still looks good and has been good since the second half of May.
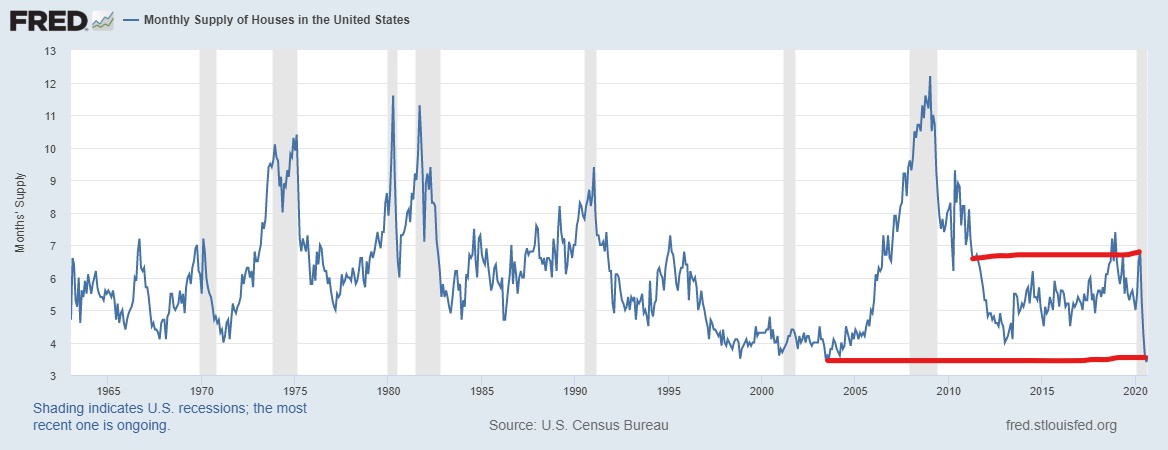
When we look at the other housing sector, new home sales, the data here also looks pretty good. Look at the monthly supply data to gauge demand in this arena. When monthly supply goes above 6.5 months, builders pull back, and new construction stalls. We saw this in 2018 and then spent the entire year of 2019 selling off the excess inventory. 2019 housing starts were roughly flat even though the new home sales data got better in the first half of 2019. This year, monthly supply went above 6.5 months only once, in April, at 6.8 months.
Except for the last three months, the monthly supply has been between 4.4- 6.5 months. This level of inventory means new home sales are doing ok, not great. The low bar that the housing market enjoyed in the previous expansion is gone, so we need to earn back the right to build more homes, which means new home sales need to grow to motivate more building.
Over the last three months supply went below 4.0 months, indicating a tremendous increase in demand. When monthly supply is below 4.3 months, things are perfect for the builders, so try not to read too much into missed headline reports or negative revisions; keep your eye on the prize, which is the monthly supply report for new homes. It is currently at 3.6 months.
To the frustration of many of our housing bubble boys and the W- and L-shaped housing crew, housing economics is incredibly dull when done right. It is not designed to generate sensational headlines. So, retain your composure if you see dramatic headlines about cracks in the very foundation of the housing market. For your sanity, just look at the data from new and existing home sales, then calmly go about your business.


