


For the first time in memory—and perhaps for the first time ever—the number of certified counselees (CCs) who are not originating HECMs exceeds the number who are. The statistics on CC fallout should send a message throughout the industry, particularly to all of us who originate, and to our direct management.Obtaining and educating a lead is a time-consuming and costly process. The old adage stands: “A bird in the hand is worth two in the bush.” This article is not advice. It is a look behind the statistics in an effort to begin to find answers to the question of where our industry is heading. In the end, the message is clear: Origination needs to find ways to close more of the applications we produce.
INCREASES IN THE DROPOUT RATES The following graphs illustrate two different types of dropout rates. The first illustrates trends while the graph below shows actual experience.
The first graph illustrates the annualized dropout rate (ADR) in applications following case number assignment (CNA) from June 2007 through October 2011. The rate is identified with the month in which the case numbers were assigned.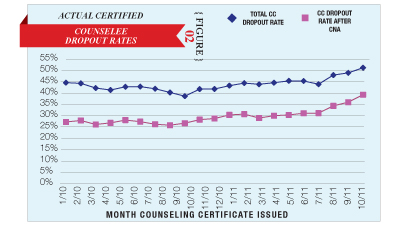 The second graph uses actual counselee information summarized and provided by HUD. It displays the dropout rates for total CCs as well as the dropout rates for CCs following case number assignment. The rates are associated with the month in which the counselor issued the counseling certificate. HUD currently lacks the data necessary to provide accurate information before January 2010 or after October 2011.
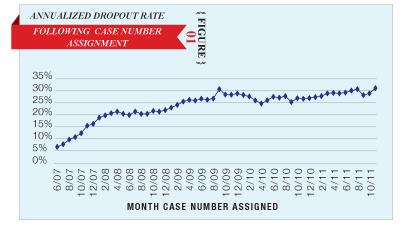 As expected, the rates are more erratic and dramatic for actual CC information than they are for the ADR following CNA. The ADR following CNA provides annualized trend estimates, while the HUD CC information is based on actual results.
THE FOUR MOST SIGNIFICANT EVENTS The first major event that increased the CC dropout rate was the severe drop in property values due to the general mortgage market collapse and the resulting burst of the so-called housing bubble. Before June 2007, when home values were rising in many parts of the country, there was little likelihood that an applicant would drop out of the loan process after a case number was assigned. Then, as property values began to erode nationally, the ADR following CNA began to rise until it plateaued sometime around May 2009. Many industry insiders blame this increase on 1) more conservative appraisal practices and requirements and 2) the failure of originators to properly prepare applicants for the shock that came when they learned that their homes were appraised for less than they had expected.
The impact caused by the second event was temporary and reflects the inordinately large quantity of case numbers assigned during September 2009. What drove up the ADR following CNA in September 2009 and shortly thereafter? Fear that principal limit factors were going down in the following fiscal year. The total case numbers assigned reached 19,055, which is 18.62 percent higher than the 16,064 CNAs in March 2009 (the second-highest month for CNA so far). Predominantly fear-driven origination motives usually result in a higher overall dropout rate, as they did here.
The 19,055 CNAs would normally turn into endorsements during the second quarter of the following fiscal year (ended 9/30/2010). But the fiscal year that followed saw the greatest total drop in endorsements in the history of the industry, more than 35,500 (a 31 percent drop, another record). Despite this, the overall ADR following CNA changed little between the two fiscal years (26.93 percent for the fiscal year ended September 30, 2009, and 27.03 percent for the fiscal year ended September 2010). The 27 percent seems to be the amount of the ADR following CNA directly related to the shock in appraised values.
The third event was the implementation of the new counseling protocol on September 11, 2010. While the new counseling protocol seems to have produced some improvement in the percentage of CCs moving to CNA, the FIT report seems to have produced just the opposite result following CNA. The ADR following CNA went up to 30.4 percent, an increase of 3.4 percent, following the introduction of the FIT report.
The fourth event is the loss of the Big Three, particularly Wells Fargo Bank and Bank of America. Without their presence, the ADR following CNA as measured by HUD has risen by as much as 9 percent, reaching a total of 39 percent. This came as a huge surprise to many of us. HUD has stated that the pull-through rates of the Big Three were much higher than the pull-through rates for the rest of the industry. This difference should be of great concern. (Only about 2.6 percent of the actually measured 9 percent has appeared so far in the ADR following CNA, but that should change shortly.)
HUD maintains that the pull-through rates are distinct for each lender. While we may not like what it took to achieve higher pull-through rates at the Big Three, we should all be interested in discovering and incorporating better origination practices in an effort to achieve better endorsement results. A few years ago, a session at NRMLA was dedicated to illustrating how providing accurate information to applicants who had dropped out before endorsement could turn a significant percentage into borrowers. That session was fascinating.
COMPUTING THE ADR FOLLOWING CNA The ADR following CNA is calculated by dividing the trailing 12-month endorsement totals for each month by the trailing 12-month total of case numbers assigned, using the four-month rule of thumb, which states that it takes four months for an application with a case number assigned to be endorsed. The data was taken principally from CNA information in the monthly FHA Single Family Outlook report and the endorsement data from the HUD HECM Endorsement Summary reports.
For example, to get the ADR following CNA for September 2008, the total endorsements for the 12 months ended January 31, 2009, were divided by the total CNA generated during the fiscal year ended September 30, 2008. Using a 12-month trailing total minimizes the impact of seasonality and significant aberrations.
IN CONCLUSION Whether it is due to a failure to manage home value expectations or poor origination practices, the recent rise and the persistent level in the fallout rate should put us all on notice that we need to find ways to improve the pull-through rates at each of our respective companies. The monetary cost and time spent in closing each loan on an industrywide basis is going up due to the increased fallout rate. We should be looking for ways to push back against this trend and close more of what we already have rather than ignoring the message found in current trends.


