My model for inventory growth with higher mortgage rates came crashing down last week. After two weeks of significant increases, inventory growth slowed dramatically and is far from my 11,000-17,000 growth model with mortgage rates over 7.25%. Did the recent dip in mortgage rates play a role here or is this the average choppy weekly data we have seen in past years? Let’s delve into the weekly data to see what we can uncover.
Weekly housing inventory data
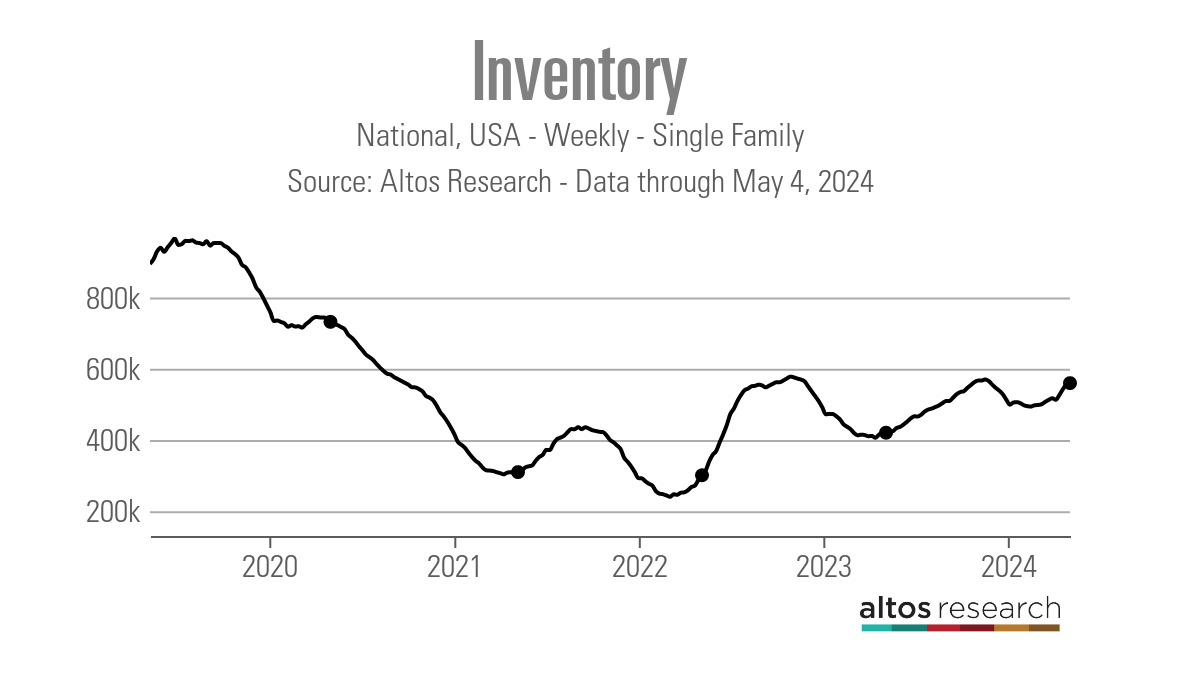
I was looking for a hat trick this week after higher mortgage rates fueled more inventory growth, but that stalled out last week. It’s important to note that the weekly data can be volatile, so I won’t overreact to one week of slow inventory growth data, but it was disappointing to see just 3,453 homes added. Last year, during this same timeframe, inventory fell week to week as well, so always remember that a trend is more important than one week’s data. Note that we do have Mother’s Day weekend next week.
- Weekly inventory change (April 26-May 3): Inventory rose from 556,291 to 559,744
- The same week last year (April 28-May 5): Inventory fell from 421,924 to 420,489
- The all-time inventory bottom was in 2022 at 240,194
- The inventory peak for 2023 was 569,898
- For some context, active listings for this week in 2015 were 1,081,867
New listings data
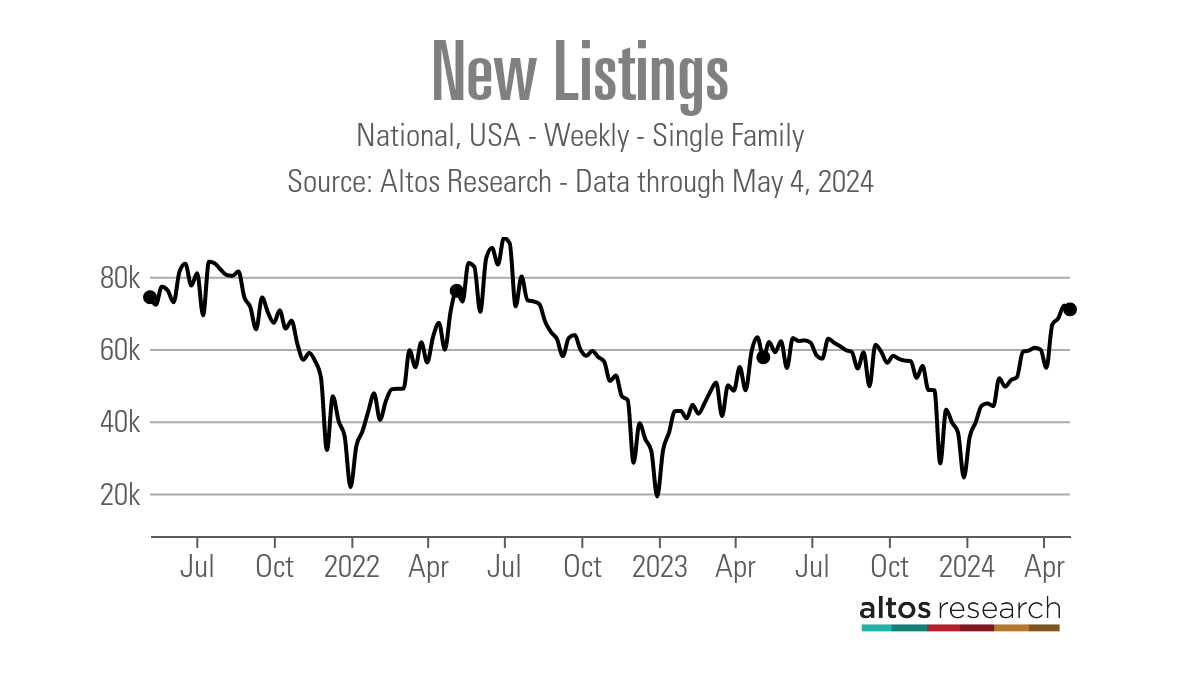
New listing data has been a positive story all year, as we have seen consistent growth from 2023 levels, which saw the lowest recorded levels of new listings ever. I wish new listings were growing faster, but I will call it a victory nonetheless. We saw a slight decline in new listings data week to week. For now, I will chalk this up to the seasonal choppiness we sometimes see with inventory data. Here’s the new listings data for last week over the last several years:
- 2024: 70,954
- 2023: 57,682
- 2022: 76,095
Price-cut percentage
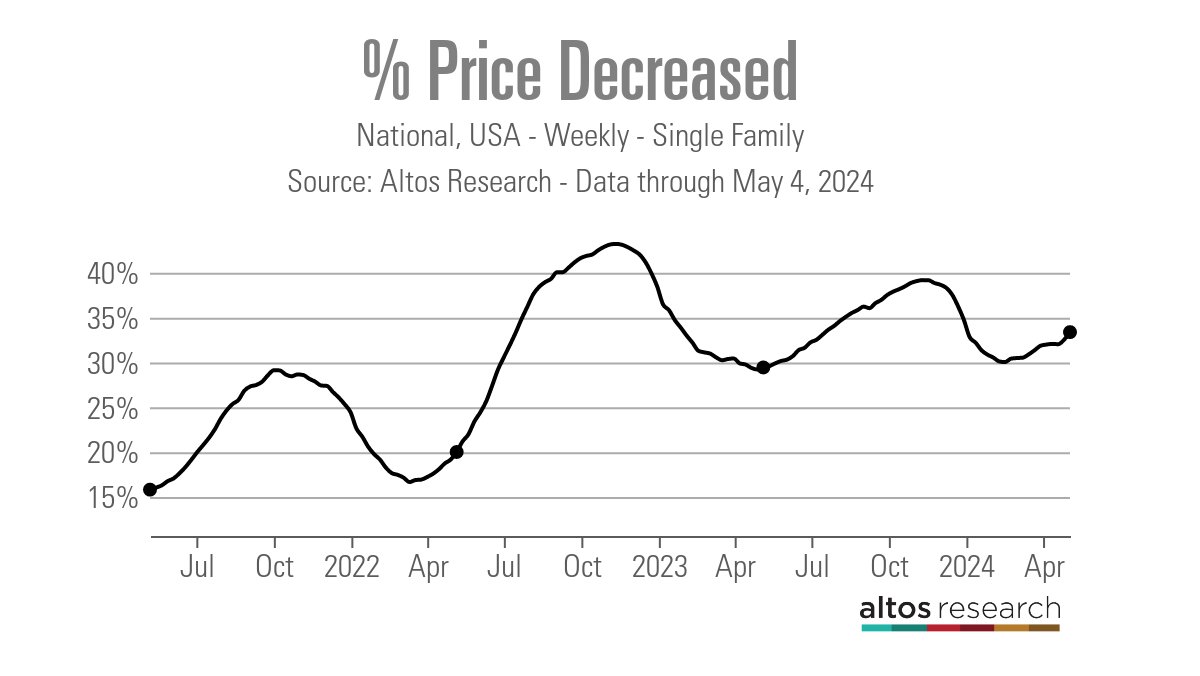
In an average year, one-third of all homes take a price cut — this is standard housing activity. When mortgage rates increase, demand falls and the price-cut percentage grows. When rates drop and demand improves, the percentage falls.
The price-cut percentage growth in 2024 is much slower than in 2022, when rates spiked more aggressively. The second half of 2022 had the biggest and fastest decline in home sales ever, and after November of 2022, the epic home sales crash stopped. This can explain why the slope of the price-cut curve was faster and stronger in 2022 than in 2023 or so far in 2024.
- 2024: 33%
- 2023: 29%
- 2022: 20%
10-year yield and mortgage rates
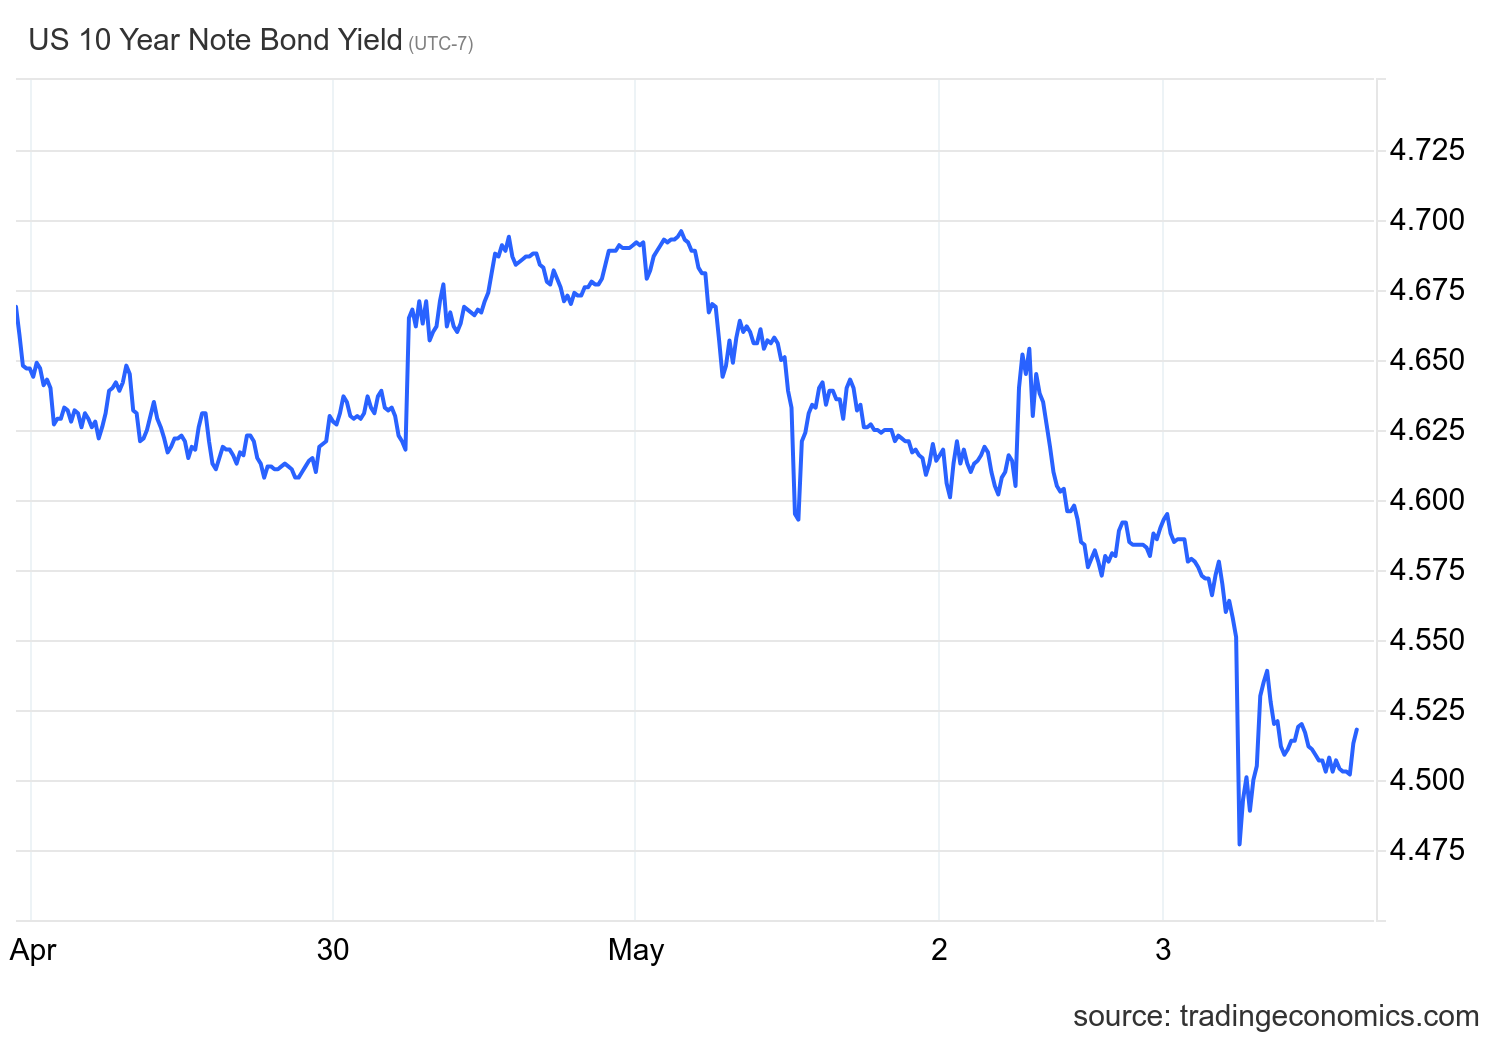
We had an exciting week with the 10-year yield and mortgage rates. The Federal Reserve tried to maintain a balanced stance on when the next rate cut would happen, which I talked about in this HousingWire Daily podcast.
Then, the 10-year yield fell after the jobs report showed that wage growth slowed. I wrote about the wage growth slowdown and how that ties into the Fed’s model in my analysis of the jobs report. Looking at all of these factors — the Fed meeting points, the softness in job openings and the jobs Friday data — can explain the decline in yields and mortgage rates last week.
Mortgage spreads have been terrible for some time now, but 2024 is far from the peak stress we saw in this data line in 2023. If we were at the same level as the worst spreads in 2023, mortgage rates would be 0.52% higher currently. So, the spreads getting better this year is a positive storyline. I hadn’t anticipated we would see this until the Fed starts cutting rates, so I got this wrong in 2024.
Purchase application data
Purchase application data didn’t move much again last week, down 2% week to week and 14% year ove year. Remember, for any growth we see in this data line in the future, context is critical since we’re working from the lowest levels ever.
Since November 2023, when mortgage rates started to fall, we have had 11 positive prints versus nine negative prints and two flat prints week-to-week. Year to date, we have had five positive prints, nine negative prints, and two flat prints.
The week ahead: Bond market digestion
This week we have a light week on the economic front with jobless claims data, used car prices and some Fed presidents talking. I will be watching the 10-year yield closely. Whenever you have jobs week combined with a Fed meeting, the bond market action can act wild, so I am interested to see how the market reacts after digesting what happened last week.