In its Q4 Mortgage Lender Sentiment Survey, Fannie Mae reported that 75% of lenders were citing “competition from other lenders” as a key business challenge, the highest since the survey began in 2014. Yesterday, the MBA reported that refinance applications for the previous week were at the lowest level since September 2008. More competition is the theme for 2018 and LendingTree has created a way for loan officers to gauge the aggregate level of price competition in the market in real time.
The LendingTree Mortgage Rate Competition Index will be released each week. It measures the spread in the APR of the best offers available on LendingTree relative to the least competitive. Our research shows that mortgage rate competition varies with financial and operational measures of activity in the mortgage markets. More details on the index are available in a white paper available at the LendingTree website.
How is the index formulated?
A mortgage shopper enters their information on the LendingTree website. They input loan variables including the proposed amount and down payment, property variables including property type and location, and personal information including income. LendingTree transmit this data, including a credit pull, to lenders who evaluate the borrower against their lending parameters in their pricing engines. Interested lenders return a rate and fee offer. For our index we combine the rate and fees into an APR and calculate the spread as follows:
|
Offers |
APR |
|
Lender 1 |
4.21 |
|
Lender 2 |
4.33 |
|
Lender 3 |
4.40 |
|
Lender 4 |
4.55 |
|
Lender 5 |
4.62 |
The spread is the difference between the highest and lowest offers, in this example 4.62-4.21 = 0.41. We repeat this calculation across 30-yr loans that week and then find the median of the individual spread which is our index value for that week. This is done separately for the population of purchase and refinance loan requests.
For borrowers, we translate the index into the Mortgage Savings Tracker, using a standard loan size of $300,000 to calculate the lifetime savings on a 30-year fixed loan.
So, what have we found in our inaugural report?
- Across all purchase loan requests on LendingTree (we looked at refinance loan requests separately) in 2017, we found an average Mortgage Rate Competition Index of 0.46 — this was the average spread between the lowest and highest APR offered by lenders.
- It may not sound like much, but over 30 years translates to $21,000 in additional costs on a $300,000 loan.
- The index was wider in the refinance market, averaging 0.55. Potential borrowers there could have saved an average of $26,000 had they shopped around to find the lowest rate.
- Ringing in the new year, the index widened to 0.59 for potential purchase borrowers, translating to a potential savings of just over $27,000.
- For potential refinance borrowers, again, the index was even higher at 0.63. That could result in a savings of almost $30,000. The savings increased because lenders are reacting differently to the overall uptick in rates.
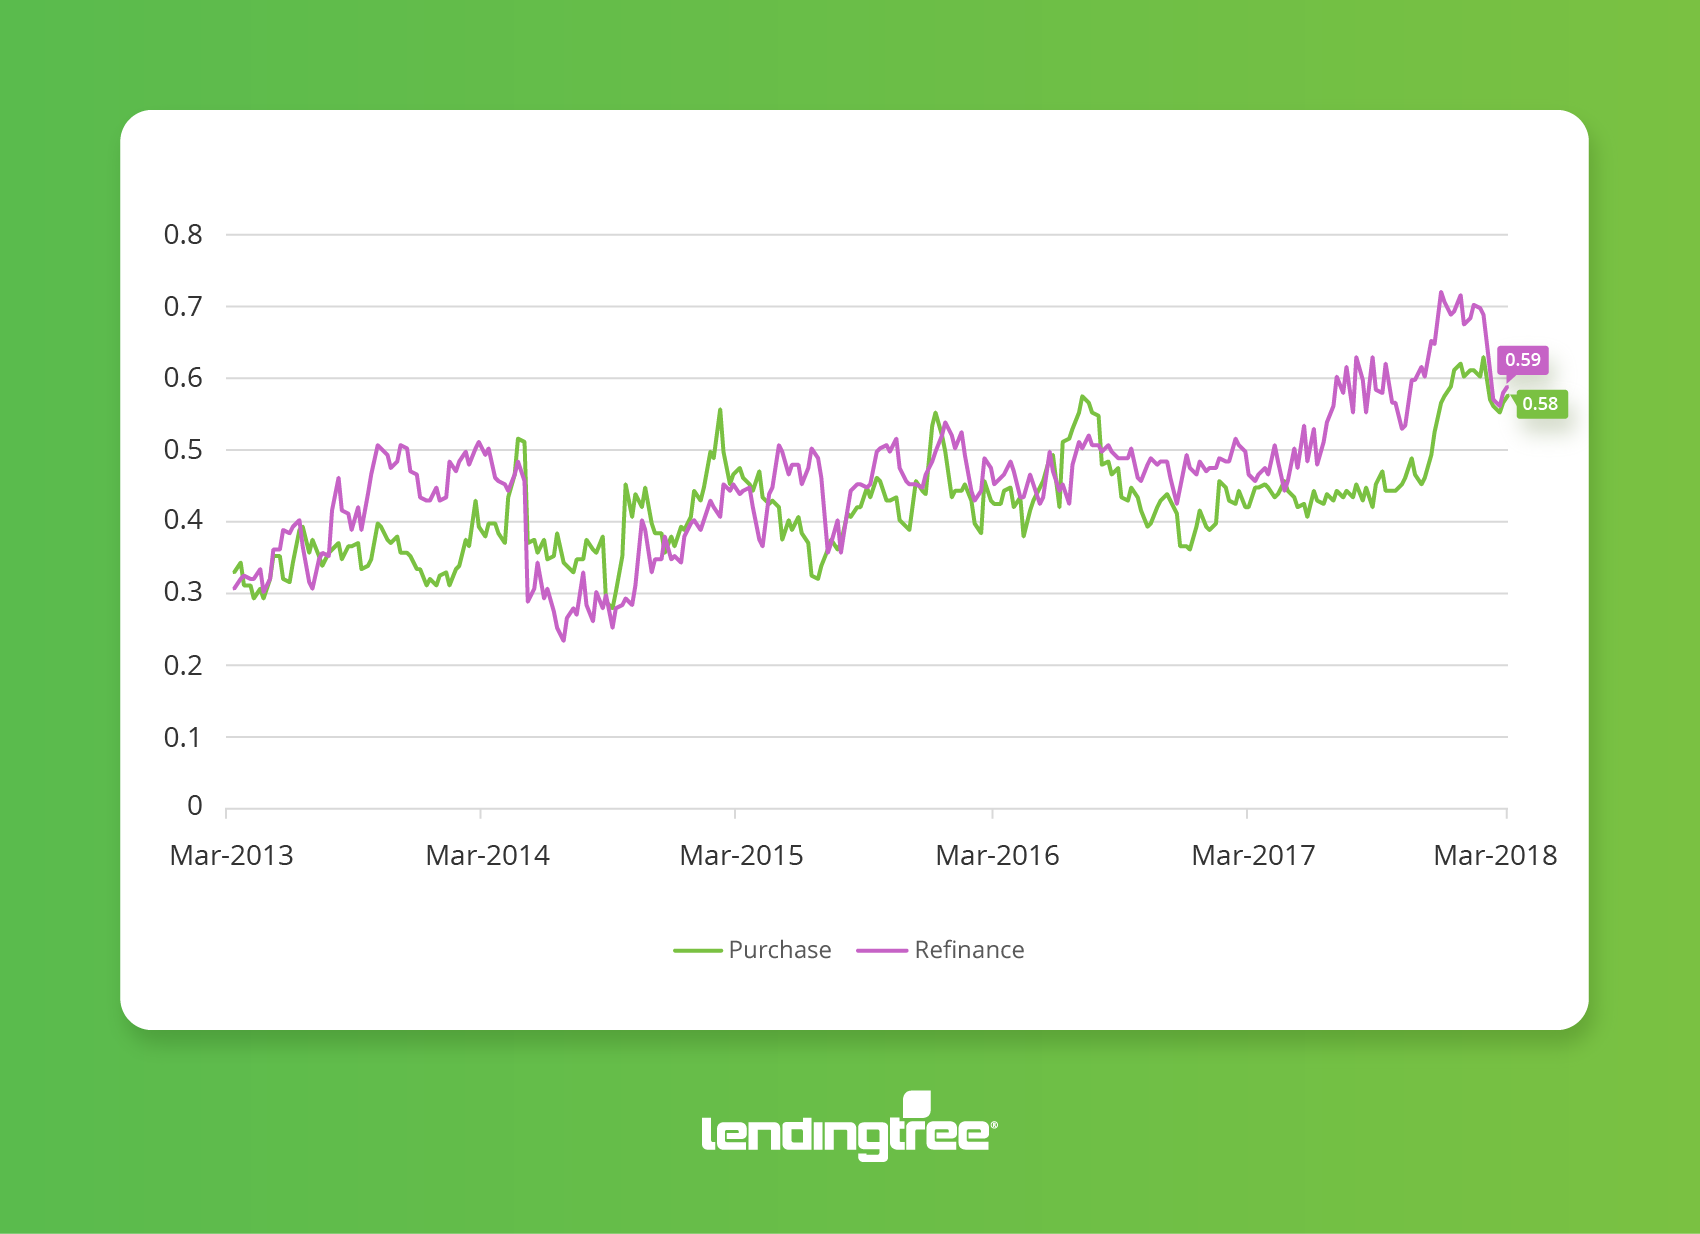
- The most recent data for the week ending 3/11/2018 showed a purchase index of 0.58 and a refinance index of 0.59 (as seen in the chart above).